
Operator`s manual


25-Point Map Display
The third window in the plot area (far left square field) is the output display for 25-point
spectral and continuum maps. When a 25-point scan is complete, a false color image of
the map area will automatically display.
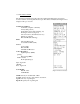
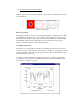
Continuum Display
Figure-7 shows the spectral display boxes as they appear during a continuum scan. The
left side box now reports information showing the number of observation cycles (in this
example, an off-on-off beamswitch observation) and the total integration time above the
graphical output.
Below the graph, the average temperature, the RMS and vertical scale are reported.
(Figure-7, Continuum Output)
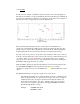
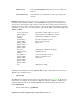
1.3.6 Total-Power Chart Recorder
(Figure-8, Total Power Chart Recorder)
The area of the SRT control console above the Sky Map is a continuously running chart
recorder showing relative power of the signal received vs. time. The plot will continually
overwrite as it paints from left to right and will reset to the bottom of the chart when the
plot value reaches the 400K vertical scale maximum. To minimize confusion when the
scale resets (400K steps), the plot is color-coded (note the color-dot icon to the right of
the temperature indicator):
black 0-400, blue 400-800, green 800-1200, red 1200-1600