
Operator`s manual


1.3.5 Spectral-line and Continuum Display
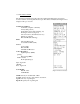
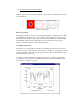
Figure-6 displays the spectral-line plotting area of the SRT control panel. There are two
spectral windows.
(Figure-6, Spectral Display)
Discrete Spectrum
The right side (black) is the plot of each individual spectrum as it finishes the user input
span in MHz (see "freq" in section 1.3.1). The top of the display lists the input center
frequency and the frequency step. The bottom line lists the difference of the maximum
and minimum values measured during the frequency scan. There is also an arrow
indicator showing the direction of increasing frequency.
Accumulated Spectrum
The left side (red) spectral-line plot shows the accumulated spectra since the selected
observation began. Listed at the top of this window is the title "av. Spectrum" as well as
the total "integration" time. The bottom script shows the same max-min difference and
increasing frequency direction.
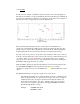
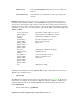
A “snapshot” of the accumulated spectrum can be seen in a “pull-down” window by
moving the mouse pointer to the accumulated spectrum window and clicking the left
mouse button. A sample is seen here: