NEROC Haystack Observatory Undergraduate Research Educational Initiative Small Radio Telescope Operator's Manual
Abstract The Haystack Observatory Small Radio Telescope was developed as an educational tool to teach concepts of radio astronomy, mechanical and electrical engineering and research methods. The two-axis motorized mount allows the telescope to point from horizon to zenith with an azimuth capability of nearly 360 degrees. All sky coverage is achieved through drift-scan methods. The kit includes antenna dish, motorized two-axis mount, receiver feed, receiver electronics and JAVAbased control software.
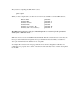
SRT Control Software Table of Contents 1. Software 1.1 Overview of Capabilities 1.2 Getting Started 1.2.1 Original Full Software installation 1.2.2 Executable Software Installation 1.3 SRT Control Panel 1.3.1 1.3.2 1.3.3 1.3.4 1.3.5 1.3.6 1.3.7 Command Toolbar Message board and Text Input Information Sidebar Sky Map Spectral-line/Continuum Display Total-Power Chart Recorder Antenna Drive/Motion Status Display 1.4 Manual Command Entry 1.5 Input Command Files 1.
1.1 Overview of Capabilities The SRT is capable of spectral line (1420 MHz hydrogen) and continuum observations using source tracking, 25-point maps and drift-scans. Aperture LO Frequency Range LO Tuning Step Preamp Frequency Range System Temperature Pointing Accuracy Travel Limits (degrees) 2.1 Meters 1370 - 1800 MHz 40 kHz 1400 - 1440 MHz 150 K 1 Degree ~360 Azimuth/~0-90 Elevation See added capabilities of the digital receiver at http://web.haystack.mit.edu/SRT/receiver_1.html 1.2.
The syntax for compiling the SRT JAVA code is: javac *.java When you have compiled the code there are six run modes available to run the SRT software; Run the SRT Simulate SRT Simulate Antenna Simulate Radio Simulate (speed time x 10) Simulate (with 1 hour advance) java srt 0 java srt 1 1 java srt 0 1 java srt 1 java srt 1 10 java srt 1 -1 The SRT window will open, ready for command input. Go to section 1.3 for the operational details of the command console.
SRT.CAT file * sample srt.cat file SIMULATE RECEIVER SIMULATE ANTENNA 10 * first word is key word * STATION: latitude longitude west in degrees * SAT: satellite ID then longitude west * SOU: source ra, dec, name, epoch STATION 42.5 71.
1.2.2 SRT Executable Software Package An installable/executable version of the SRT control software is now available for MS-Windows based operating systems (95,98,Me,NT,XP). The advantages of this downloadable file are: 1. The user no longer will need to import a large Java Development Kit. 2. The SRT java files are compiled and ready to run. 3. The win32com.dll, comm.jar and javax.comm.properties files are automatically installed into their proper sub-directories and the proper CLASSPATH is set. 4.
3. Click on the SRT.CAT icon. This should open Notepad or another selected editor. 4. You will find a pair of SIMULATE keywords in the file. Inserting an asterisk in the first column means the SRT will run in full function mode * SIMULATE RECEIVER * SIMULATE ANTENNA Removing the asterisks means the SRT will run in full simulation mode SIMULATE RECEIVER SIMULATE ANTENNA nnnn where, nnnn = an integer time multiplier.
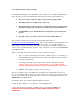
(Figure-1, SRT Console) 1.3 SRT Control Panel The user interface to the SRT is an interactive JAVA-generated window. The window consists of a 15 button tool-bar, a text entry command bar, an information side bar listing; times, coordinates, and source information, observing frequency and system temperatures, and a sky-map showing antenna travel limits, azimuth and elevation tick marks, as well as source plots and galactic coordinates.
(Figure-2 Command Toolbar) clear - As the label implies, the clear button will clear the control console display of accumulated spectral-line data, 25-point scan data. This function is useful if the user is accumulating multiple spectra from different sources or galactic coordinates. The system will treat new source spectra as additions to the accumulated spectrum. atten - Enabling the atten (attenuation) button adds or removes a 10dB attenuation to the receiver with successive left-button mouse clicks.
npoint - Initiates a 25-point scan/map of the source selected. The map is 1/2 beamwidth spaced and when finished displays a false-color, gaussian plot to the left of the accumulated spectrum plot. (This plot will clear when the clear button is enabled). The resulting maximum T(ant) (with associated offset) is displayed under scan results in the information sidebar. The color plot will NOT refresh if the SRT window is reduced then refreshed.
Drift - A left mouse click on Drift will offset the SRT in Right Ascension and Declination to allow the selected source to drift through the 7-degree beam of the telescope. record - Toggles output file recording on and off. Output data files are labeled in the form: yydddhh.rad Record also allows the user to enter a filename. Rcmdfl - Initiates reading of the default command file (srt.cmd) and begins data recording.
1.3.2 Message Board and Text Input (Figure-3, Message Board and Text Input) The command text-input box and the system message board are located at the bottom of the SRT control-panel window (figure-3). Many of the actions initiated by clicking the command toolbar are implemented by entry of parameter settings in the text box. Information regarding the correct entry is printed in a message board above the text entry area when the mouse pointer is moved over the desired command button.
1.3.3 Information Sidebar The information sidebar lists nearly all of the pertinent information the user needs to monitor real time observing with the telescope.
1.3.4 Sky Map The most obvious feature of the SRT control panel window is the sky map (Figure-5). The map shows full sky coverage in azimuth and elevation with 10-degree tick marks in both axes. The azimuth axis is labeled every 20 degrees, the elevation every 10 degrees. The elevation scale is exaggerated 33% from the azimuth scale. (Figure-5, Sky Map) Plotted automatically and labeled are the sources listed in the srt.cat file.
1.3.5 Spectral-line and Continuum Display Figure-6 displays the spectral-line plotting area of the SRT control panel. There are two spectral windows. (Figure-6, Spectral Display) Discrete Spectrum The right side (black) is the plot of each individual spectrum as it finishes the user input span in MHz (see "freq" in section 1.3.1). The top of the display lists the input center frequency and the frequency step.
25-Point Map Display The third window in the plot area (far left square field) is the output display for 25-point spectral and continuum maps. When a 25-point scan is complete, a false color image of the map area will automatically display. Continuum Display Figure-7 shows the spectral display boxes as they appear during a continuum scan.
1.3.7 Antenna Drive/Motion Status Display This box, at the upper left of the control console display, (Figure-9) shows the station name, latitude and longitude as read from the srt.cat file. The second line lists the current antenna drive status, such as, moving, simulate, stopped … (Figure-9, Motion Status Display) 1.4 Manual Command Entry Most users will start SRT observations by entering text commands into the text box at the bottom of the control console. As explained in Section 1.
Combination Manual and Button commands (preferred!) 1. Move the mouse to the source on the map and left click. 2. Move the mouse pointer to the track button and click 3. Click on the freq button then type: 1419.0 (in the command text box) 4. Click on the Cal button 5. Click on the freq button then type: 1420.4 4 (in the command text box) 6.
LST:06:00:00 /wait until LST 06:00:00, taking data, before proceeding to the next line 2005:148:00:00:00 /wait until UT= yyyy:ddd:hh:mm:ss, before proceeding to the next line Example Set: Instructions can be set in order to perform an observation. The following set of instructions will command the SRT to take 1420.4 MHz hydrogen spectra in 5 degree spacing along a section of the galactic equator.
1.6 Output Data Files The output data file (yydddhh.rad) is an ASCII text file. Data reduction on the raw output can be done with a spreadsheet program like MS Excel with some effort. The development of spreadsheet MACROS to reduce the data are desirable for large files and long integrations. Future releases or updates of the SRT software could also output certain observations in formats for other data reduction methods.
OUTPUT: 0514814.rad * STATION LAT= 42.50 DEG LONGW= 71.50 2005:148:10:55:41 92.0 5.0 0.0 0.0 1419.75 0.00781250 1 64 4.7 5.9 10.5 20.1 40.1 70.2 107.5 154.3 218.1 219.9 223.5…….….224.5 216.5 151.1 111.2 70.2 41.9 21.1 10.3 5.8 (the data stream above actually has about 151 data points. It is truncated for this example) * STATION LAT= 42.50 DEG LONGW= 71.50 * test.cmd: line 1 : record 2005:148:14:32:44 104.5 16.0 0.0 0.0 1419.75 0.00781250 * test.cmd: line 2 : azel 125 45 2005:148:14:32:49 125.0 45.0 0.0 0.
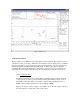
Haystack Observatory - - Small Radio Telescope Measure Antenna Beamwidth using the Sun as a Signal Source Introduction: The beamwidth of a radio telescope is the solid-angle measure of the half-power point of the main lobe of the antenna pattern. The half-power beamwidth (HPBW) can be measured by moving the telescope in a continuous scan across a very bright radio source. Except for the possibility of Cygnus-X or certain geo-synchronous satellites, the only source available to the SRT is the Sun.
SRT Commands: Move the mouse pointer to the upper right of the control console and click the button labeled: Rcmdfl Move the mouse pointer down to the command line input box and type the SRT command filename you wish to open: Filename.cmd /*example = beamsize.cmd (the suffix .
Azimuth Sun-scan 2800 2600 2400 2200 2000 T(ant) degrees K 1800 1600 1400 -15 -10 -5 0 5 10 15 1200 1000 800 600 400 200 0 Offset degrees (Az/cosEl) Elevation Sun-scan 3000 2800 2600 2400 2200 T(ant) degrees K 2000 1800 1600 1400 1200 -25 -20 -15 -10 -5 0 1000 800 600 400 200 0 Offset degrees 5 10 15 20 25
Haystack Observatory - - Small Radio Telescope Measure Aperture Efficiency Introduction: Aperture efficiency η, is the ratio of the effective aperture of a radio telescope divided by the true aperture. True aperture A, is defined as the collecting area of the telescope surface.
LST 18:00:00 : record filename : azel 80 45 : freq 1419 20 0 : 1419.
This output plot is generated from analog receiver data. Antenna temperature (K) beamswitching - thick lines indicate onsource av.signal 2.96 K +/- 0.24 K integ. 176 sec 10.0 0.0 5 10 15 20 25 30 35 40 45 50 55 60 65 70 75 80 85 cycle SRT D:srtjavascratchcasbeam2.