
Technical data

MIQ/CR3; DIQ/CR3 Settings
4 - 11
ba76032e01 01/2012
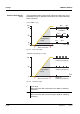
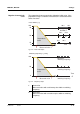
Negative characteristic
curve
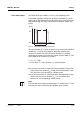
The proportional output range begins below the initial value. If the
proportional range is undercut or exceeded, the selected behavior
comes into force.
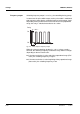
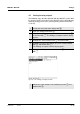
Fig. 4-10 Pulse width output
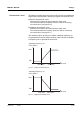
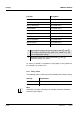
Fig. 4-11 Frequency output
1 Start value
Measured value with a minimum pulse width or switching
frequency
2 End value
Measured value with a maximum pulse width or switching
frequency
0
10
50
90
100
Proportional
band
t
On
t
Of f
50% 50%
10 %
10 %
90%
90%
Cycle
duration T
Time
Measured value
12
Pulse v [%]
width
0
50
100
Measured value
Proportional
band
1
50 % of maximum
switching frequency
Maximum
switching frequency
Time
2
Switching frequency f [1/min]
Minimum
switching frequency