
User guide


Charnwood Dynamics Ltd.
Coda cx1 User Guide – Reference IV-1
CX1 USER GUIDE - COMPLETE.doc 26/04/04
124/162
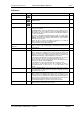
Views menu
New Graph View...
Ctrl+G
Opens the Edit Graph Plots dialogue to create a new graph View.
Graphs show any number of plots of a number of different data types,
plotted against Time or Marker position.
Any number of graph Views may be displayed.
All graphs have two cursors, and are auto-scaled. The cursors are
synchronized between all graphs, and the Left cursor is synchronized
with the Stick-figure Views.
The time range (for all Graphs) may be zoomed to the period between
the cursors (using the Cursors: Zoom Graphs to Cursors command).
The dialogue includes options to show the zero ordinate value,
annotate the y-axis, and to show the cursor times in percent.
Edit Graph Plots...
Opens the Edit Graph Plots dialogue to edit the selected graph.
The dialogue opens with the currently selected plot highlighted in the
plot list. Each plot may be edited (offset, scale, slope, colour) or
deleted.
New plots may be added.
Use thick lines on graphs
(toggle) Plot all plots on all graphs with thick lines to improve visibility for
demos/presentations.
This item is checked when plot lines are thick.
White background
Sets background colour on graphs and Stick-figure Views to white for
printing.
New Stick-figure View
Open a new Stick-figure View w
indow (with the default view options).
Use the Stick-figure View Options... command to change the View
options.
Any number of Stick-figure Views may be opened.
Stick-figure View Options...
Opens the Stick-figure Viewing Options dialogue to change the
viewing axis for this stick-figure view, and to select other display
options.
For a real-time Stick-figure view, this dialogue also allows the viewing
area (scale) to be defined.
Switch Viewing Axis
Change the Stick-figure viewing direction for the selected Stick-figure
View. Each time this command is selected, the viewing axis is changed
in the sequence X > Y > Z > Variable.
Show Trails
(toggle)
Ctrl+T
Turns on the Trails option for the selected Stick-figure View.
The spacing of the snail-trail figures depends on the current animation
rate which is changed with the Cursors: Animate Faster, Animate
Slower commands (PgUp, PgDown)
This item is checked when the Trails option is On.
Trails may be activated temporarily for all Stick-figure views by holding
down the Ctrl key when operating the keyboard animation controls
(arrow keys).
Show all Markers
Shows all markers on Stick-figure View.
Zoom View in/out
Enlarge or reduce a Stick-figure display.
When a Stick-figure View is selected, the magnifying-glass control tool
is activated. The selected view can be enlarged or reduced by clicking
the left mouse button down (& held down) at the centre of interest, then
moving the mouse up or down (while holding the mouse button down).
The View is automatically scrolled sideways and/or up & down to keep
the click-down point stationary, as far as possible.
The control is de-activated as soon as the mouse button is released, or
if it is clicked down when the cursor is not over the selected Stick-figure
View window.
Pan & Tilt View
Pan & Tilt a variable-axis (3D) stick-figure display.
When a variable-axis Stick-figure View is selected, the Pan&Tilt control
tool is activated.
If the left mouse button is clicked down (& held down) over the Stick-
figure view, the view is panned by moving the mouse sideways, and
tilted by moving the mouse up & down.
The view rotates as if the mouse is moving the viewing position.
The click-down point is of no significance.
The control is de-activated when the mouse button is released, or if it is
clicked down when the cursor is not over the selected Stick-figure View
window.