
User manual

Chapter 4: Configuration
98-143082-A Support features 43
Support features
To open the Support page, select (Control panel) > Support.
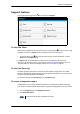
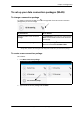
To view the Alerts
When an alert is registered, the web interface shows a warning icon in the icon bar as long
as the alert is active. The Alerts list only shows alerts that are currently active.
1. To view the alerts, click
from the icon bar at the top of the web interface, or select
Alerts from the Support page.
The Alerts page shows a detailed list of active events including the time of the first
occurrence, ID and severity of the event message, and a short text describing the error. For
more information on the event messages, refer to List of messages on page 76.
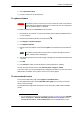
To view the Event log
The Event log shows events that occurred in the past and are no longer active. It includes
events of informational character describing normal phases of operation for the terminal, and
also alerts that have appeared in the Alerts list.
To view the event log, select Event log from the Support page.
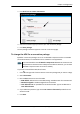
To create a diagnostics report
The diagnostic report contains relevant information for troubleshooting. When contacting
your supplier for support, please enclose this file. To generate a diagnostic report, do as follows:
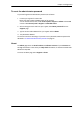
1. From the Support page, click Diagnostics report.
2. Click Generate report.
Note
It may take a few minutes to generate the report.