
User manual

Active Monitor
Cobalt RaQ XTR User Manual 173
Active Monitor status table
To view the Active Monitor status of a system component or a service:
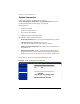
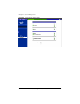
1. Select Server Management > Active Monitor. The status tables appear; see
Figure 86.
2. The status of each of the items is indicated by a green, yellow, red or grey
circle beside each item. The colors have the following significance:
• Grey—No information is available or the service is not enabled.
• Green—The services and components are functioning normally.
• Yellow—There is moderate use on the server or a component is
recovering.
• Red—There is heavy use on the server or a failure.
3. To view detailed status information for a particular system component or
service, click the green magnifying-glass icon in right column that
corresponds to the name of the item.
The detailed status information for the Disk Integrity (RAID) displays a text
and graphic representation of the status of the hard disk drives in the server.
It also indicates the number of hard disk drives present and the level of
RAID that has been implemented.
The detailed status information for the Fans displays a text and graphic
representation of the status of the six fans in the server.
✍
Note: For more information on replacing a hard disk drive or a fan,
see Appendix C, “Upgrading the RaQ XTR”.