
User manual

Server Usage
Cobalt RaQ XTR User Manual 151
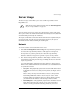
Server Usage
The Server Usage section allows you to view overall usage statistics for the
RaQ XTR server.
You can generate server-usage reports for a selected range of dates. The reports
allow you to monitor the amount of bandwidth consumed by network, Web, FTP
and email traffic generated by the virtual sites.
The reports contain both current data and data that has been compiled from past
processed log files. Log files are processed daily at 04:00 a.m.; this process
summarizes the data without retaining the actual log file.
Network
To view the statistics for network traffic on the server:
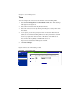
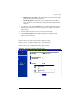
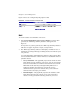
1. Select Server Management > Server Usage. If a report has been generated,
the “Network Usage Summary Statistics” table appears. See Figure 69.
If a report has not yet been generated, the “Network Usage Summary
Statistics” table does not appear. To generate a report, see Step 3 below.
2. The “Network Usage Summary Statistics” table displays a number of rows
of information concerning network usage, including the dates for which the
report was generated.
A second table entitled “Other Network Usage Statistics” offers hypertext
links for more detailed information. Click on a link to see a detailed bar chart
for a particular criterion.
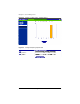
• Use by IP—This graphically represents the network traffic broken down
by IP addresses on the server, both past and present. See Figure 70 for a
sample.
There is always an entry for the IP address 127.0.0.1; this represents
internal RaQ XTR traffic. There is also an entry for “other” which
represents traffic not destined for this server. These statistics can help
you determine the IP addresses with the largest amount of traffic.
• Periodic Reports—This graphically represents the cumulative network
traffic broken down by hour of the day or day of the week. These
statistics can help you determine the busy periods for your server.
✍
Note: For the Usage Statistics feature under the Site Management
tab, see “Usage statistics” on page 93.