
User manual


Chapter 4: Site Management
98 Cobalt RaQ XTR User Manual
Mail
To view the statistics for email traffic on the virtual site:
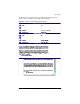
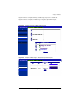
1. Select Site Management > Usage Statistics > Mail. If a report has been
generated, the “Mail Usage Summary Statistics” table appears. See
Figure 48.
If a report has not yet been generated, the “Mail Usage Summary Statistics”
table does not appear. To generate a report, see Step 3 below.
2. The “Mail Usage Summary Statistics” table displays a number of rows of
information concerning email usage, including the dates for which the report
was generated.
A second table entitled “Other Mail Usage Statistics” offers hypertext links
for more detailed information. Click on a link to see a detailed bar chart for a
particular criterion.
• Periodic Reports—This graphically represents the cumulative email
traffic broken down by hour of the day or day of the week. These
statistics can help you determine the busy periods for the virtual site.
• Historical Use—This graphically represents the total email traffic
broken down by specific day, week or month during the report period.
This statistic can help you determine the busiest specific day, week or
month for email traffic on the virtual site.
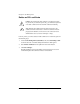
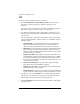
• Mail Sent or Received by Address—This shows the email addresses of
the users on the virtual site who sent mail and the email addresses that
received mail from users on the virtual site. See Figure 49 for a sample.
• Download log file—This allows you to download the current email
traffic log file. You can then analyze the log file with external analysis
software.
3. To generate a report, click Customize. The “Configure Reporting Options”
table appears. You can generate a new report for a selected range of dates.
4. From the pull-down menus, choose a start date and end date.
5. Click Generate Report. The “Mail Usage Summary Statistics” table
appears with the new data.