
Help
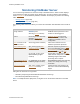
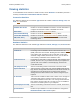
Table Of Contents
- FileMaker Server 9 Help
- About FileMaker Server
- New features in FileMaker Server 9
- Deploying FileMaker Server
- Starting Admin Console
- Hosting databases
- Hosting websites
- Starting and stopping FileMaker Server
- Configuring general settings
- Configuring Database Server settings
- Configuring web publishing settings
- Administering clients
- Administering databases
- Using ODBC and JDBC with FileMaker Server
- Monitoring FileMaker Server
- Managing plug-ins
- Securing your data
- Scheduling administrative tasks
- Troubleshooting
- Checking for updates
- About the license key
- Command line reference
- Glossary
- Registration
- Customer support and Knowledge Base
- Copyright information

Monitoring FileMaker Server Viewing statistics
F
ILEMAKER SERVER 9 HELP 108
Viewing statistics
To view FileMaker Server statistics in Admin Console, choose Statistics. The Statistics pane lists a
summary of Connection and Database Statistics attributes.
Connection Statistics
The attributes collected for each statistic Type include the number of Current, Average, Low, and
Peak client
connections.
Database Statistics
The attributes collected for each statistic Type include the Current, Average, Low, and Peak value.
Statistic Description
FileMaker Pro Clients Number of connected FileMaker Pro clients. Use this information to
configure the maximum number of FileMaker Pro clients.
ODBC/JDBC Number of connected ODBC/JDBC clients.
Instant Web Publishing Number of connected Instant Web Publishing
clients.
Custom Web Publishing
(PHP, XML, XSLT)
Number of connected Custom Web Publishing clients. Use this
information to configure the maximum number of Custom Web
Publishing clients.
Statistic Description
Cache Hit % Percentage of times FileMaker Server retrieved data from the cache
(RAM) rather than the hard disk. Reading data from RAM is much
more efficient than rereading it from the hard disk, so this value
should be a high number, like 90 or 95. If it isn't, you can allocate
more memory to FileMaker Server database cache.
Cache Unsaved % Percentage of cache that is currently unsaved. This should be a low
number, such as 0 or 5, so you won't lose data if you experience a
system crash. If the number is consistently high, decrease the
cache flush interval.
Disk (Kbytes/second) Amount of data being written to disk. Data is measured in KB.
Elapsed Time/Call Time to process a remote call. If the average Elapsed Time/Call is
high, but the average Wait Time/Call is low, ask clients whether the
operations they are performing on the Server have changed.
Adding indexes for more fields or other solution changes may be
required.
I/O Time/Call Time a remote call waits for disk reads or writes. If the average I/O
Time/Call is high and the average Cache Hit % is low, you can
increase the Database Cache Size. If the average I/O Time/Call is
high and the average Cache Hit % is high, you can use additional
hard drives or a RAID system on your computer.
Network (Kbytes/second) Amount of data being transferred across the network, measured in
KB.
Open Databases Number of open databases. Use this information to configure the
Maximum number of files to host option.