
User manual


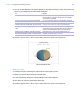

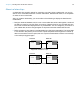


Table Of Contents
- Contents
- Chapter 1 Introducing FileMaker Pro
- Chapter 2 Using FileMaker Pro
- About fields and records
- Opening and closing files
- Opening multiple windows per file
- Saving files
- About modes
- Viewing records
- Adding and duplicating records
- Deleting records
- Entering data
- Working with data in Table View
- Finding records
- Sorting records
- Previewing and printing files
- Backing up files
- Setting preferences
- Chapter 3 Designing and creating solutions
- Planning a solution
- Creating a FileMaker Pro file
- Creating and changing fields
- Setting options for fields
- Creating database tables
- Creating layouts and reports
- Working with layout themes
- Working with layout object, part, and background styles
- Setting up a layout to print records in columns
- Working with objects on a layout
- Working with fields on a layout
- Working with layout parts
- Creating and editing charts
- Chapter 4 Working with related tables and files
- Chapter 5 Sharing data
- Sharing databases on a network
- Importing and exporting data
- Supported import/export file formats
- Setting up recurring imports
- ODBC and JDBC
- Methods of importing data into an existing file
- About adding records
- About updating existing records
- About updating matching records
- About the importing process
- Converting a data file to a new FileMaker Pro file
- About the exporting process
- Working with external data sources
- Publishing solutions on the web
- Chapter 6 Protecting files
- Protecting databases with accounts and privilege sets
- Creating accounts and privilege sets
- Viewing extended privileges
- Authorizing access to files
- Security measures
- Enhancing physical security
- Enhancing operating system security
- Establishing network security
- Backing up databases and other important files
- Installing, running, and upgrading antivirus software
- Chapter 7 Using FileMaker Pro Advanced
- Index

Chapter 3 | Designing and creating solutions 81
Subsummary parts appear in Table View and List View when sorted by break fields, and update
dynamically whenever data in the file is changed.
Creating and editing charts
You can create various types of charts in FileMaker Pro to compare data graphically. Before you
create a chart, think about the data comparison that you want to emphasize, then choose the
FileMaker
Pro chart type that will show the comparison clearly.
Place the Product Name break field in a
subsummary part in Layout mode
The number of items for
each product in stock is
displayed in Browse and
Preview modes or when
data is printed as a
report
Use To
Column chart (vertical)
or bar chart (horizontal)
Compare increases to decreases, highest with lowest, how many, or how often. For
example, show monthly sales for several products.
Stacked column chart
(vertical) or stacked bar
chart (horizontal)
Compare parts to the whole. For example, compare annual sales figures over several
years.
Positive/negative
column chart
Compare positive and negative values. For example, compare earnings to losses.
Pie chart Compare percentages of individual parts within the whole. For example, show the
percentage of each product sold within total sales.
Line chart Show data that changes continuously over time, such as historical financial data.