
Help


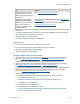


Table Of Contents
- Using FileMaker Pro
- FileMaker Pro basics
- New features in FileMaker Pro 13
- Using Help
- Using FileMaker Quick Start to learn more about FileMaker Pro
- Converting the trial version to the full version of FileMaker Pro
- About FileMaker Pro databases
- About FileMaker Pro modes
- Performing menu commands
- Converting files from FileMaker Pro 11 and earlier
- Conversion overview
- Converting a single file
- Converting multiple files at once
- Reading the Conversion.log file
- Converting FileMaker Pro databases earlier than version 7.x
- Troubleshooting conversion problems
- Preserving user dictionary information
- How layouts are converted
- Layout mode changes and improvements (FileMaker Pro 12)
- Managing files
- Starting FileMaker Pro
- Using FileMaker Quick Start to open files
- Working with favorite files and hosts
- Opening files
- Opening files with different system formats
- Opening files troubleshooting
- Using the zoom controls
- Opening multiple windows per file
- Arranging windows in FileMaker Pro
- Closing windows and files
- Closing files troubleshooting
- Saving and copying files
- Quitting FileMaker Pro
- Adding and viewing data
- Working with records in Browse mode
- Working with data in Table View
- Adding, duplicating, and deleting records
- Entering data in records
- Selecting a field in Browse mode or Find mode
- Entering and changing data in fields
- Moving text and data with drag and drop
- Exporting the contents of a field
- Working with data in date fields
- Entering Japanese Emperor Year dates
- Conversion of dates with two-digit years
- Working with data in time fields
- Committing data in records
- Using URLs in a field
- Copying and moving data in records
- Entering preset data from a value list
- Restoring data in records
- Using a field index
- Inserting the current date or other variables into a field
- Editing and formatting text
- Using data in container fields
- Inserting graphics into container fields
- Inserting QuickTime movies and multimedia into container fields
- Inserting files of any type into container fields
- Pasting graphics and movies from the Clipboard
- Playing QuickTime and QuickTimeVR movies in container fields
- Playing recorded sounds in container fields
- Working with content in interactive containers
- Working with PDF files in interactive containers
- Deleting data from container fields
- Checking spelling
- Replacing the contents of a field
- Adding and viewing data troubleshooting
- Records are missing
- Wrong or missing data in field
- Dates are not as expected
- Summary data is missing or incorrect
- Text or objects are clipped
- Data does not appear correctly
- List View or Table View refreshes when adding records
- Can't click or tab into a field
- Alerts when entering data
- Value lists troubleshooting
- Finding, sorting, and replacing data
- Finding records
- Performing a quick find in Browse mode
- Finding records based on criteria in a single field
- Making a find request
- Finding text and characters
- Finding numbers, dates, times, and timestamps
- Finding ranges of information
- Finding data in related fields
- Finding empty or non-empty fields
- Finding duplicate values
- Finding duplicate values using a self-join relationship
- Finding records that match multiple criteria
- Finding records except those matching criteria
- Viewing, repeating, or changing the last find
- Hiding records from a found set and viewing hidden records
- Constraining (narrowing) a found set
- Extending (broadening) a found set
- Finding records troubleshooting
- Saving a find request
- Managing saved find requests
- Sorting records
- Finding and replacing data
- Finding records
- Previewing and printing information
- FileMaker Pro basics
- Designing and creating databases
- Creating a database
- About planning a database
- Best practices for designing layouts
- Tips for designing layouts
- Creating a FileMaker Pro file
- Setting file options
- Defining database tables
- About defining database fields
- About choosing a field type
- Setting options for fields
- About setting up container fields
- Changing field definitions
- Creating file paths
- Using variables
- Working with formulas and functions
- About functions
- About formulas
- Using operators in formulas
- Identifying text constants and special characters in formulas
- Adding a new line to the results of a formula
- Adding comments to a formula
- Using a reserved word or symbol for a field or table name
- Getting the contents of a repetition in a repeating field
- Working with plug-ins
- Creating and managing layouts and reports
- Creating a layout
- Editing layouts
- Setting up form, list, and table views for a layout
- Changing the table that a layout shows
- Setting the automatic record-saving option for a layout
- Showing or hiding field frames
- Showing field borders and fill for the current record
- Specifying a menu set for a layout
- Changing the theme of a layout
- Changing the width of a layout
- Working with layout parts
- Adding fields to a layout
- Creating portals to display related records
- Drawing and inserting objects on a layout
- Working with panel controls on layouts
- Working with popovers on layouts
- Working with web viewers on layouts
- Controlling how layouts print
- Setting up script triggers
- Troubleshooting layouts
- Editing objects, layout parts, and the layout background
- Selecting and working with objects on a layout
- Selecting objects
- Using the Inspector to format objects
- Copying, duplicating, and deleting objects
- Moving objects on a layout
- Resizing and reshaping objects
- Setting auto-resize options for layout objects
- Specifying the display state for an object
- Formatting graphics on a layout
- Protecting objects from change
- Naming objects
- Defining conditional formatting for layout objects
- Formatting objects, layout parts, and the layout background
- Setting the fill, line style, and borders for objects, layout parts, and the layout background
- Filling objects, layout parts, or the layout background with a color gradient
- Filling objects, layout parts, or the layout background with an image
- Adding shadows and padding to layout objects
- Formatting portals
- Formatting panel controls
- Formatting popover buttons and popovers
- Hiding or showing layout objects
- Creating and working with styles for layout objects, parts, and the layout background
- About layout object, part, and background styles
- Viewing and applying layout object, part, or background styles
- Editing layout object, part, or background styles
- Creating new layout object, part, or background styles
- Renaming layout object, part, or background styles
- Reverting changes to layout object, part, or background styles
- Deleting layout object, part, or background styles
- Copying formatting attributes between layout objects, parts, or backgrounds
- Saving and managing layout themes
- Formatting and setting up field objects in Layout mode
- Specifying text formats for fields
- Specifying formats for fields containing numbers
- Specifying formats for date fields
- Specifying formats for time fields
- Specifying formats for timestamp fields
- Specifying formats for container fields
- Adding borders, fill, and baselines to fields
- Adding scroll bars to fields
- Defining value lists
- Setting up a field to display a pop-up menu, checkbox set, or other control
- Setting up a field to display a keyboard
- Setting up a field to display a drop-down calendar
- Setting up a field to auto-complete during data entry
- Setting up the display of repeating fields
- Adding tooltips on layouts
- Identifying badges on layout objects
- Making layout objects accessible to screen readers
- Controlling data input behavior of fields
- Formatting text
- Arranging objects
- Using tools to precisely position objects
- Selecting and working with objects on a layout
- Working with related tables and files
- About relationships
- About the types of relationships
- Working with the relationships graph
- Creating relationships
- Changing relationships
- Adding tables to the relationships graph
- Selecting related tables in the relationships graph
- Duplicating tables in the relationships graph
- Moving tables or notes in the relationships graph
- Resizing tables in the relationships graph
- Aligning tables in the relationships graph
- Adding text notes to the relationships graph
- Summarizing data in portals
- Filtering records in portals
- About lookups
- Creating charts from data
- Creating scripts to automate tasks
- Planning a script
- Creating and editing scripts
- Scripting with ActiveX Automation (Windows)
- Scripting with Apple events (OS X)
- Apple events troubleshooting (OS X)
- Apple events error: "Apple event timed out" (-1712)
- Apple events error: "Expected expression but found unknown token"
- Apple events error: "Invalid object containment" (-1723)
- Apple events error: "Object not found" (-1728)
- Apple events error: "Data is being accessed by another user, script, or transaction" (-10011)
- Apple events error: "Set Data failed. Invalid data was supplied" (- 17005)
- Apple events error: "Event failed. User canceled the event processing" (-17006)
- Apple events error: "Create failed. Invalid data was supplied" (- 17007)
- Working with the Scripts menu
- Using buttons with scripts
- Script examples
- Protecting databases
- About protecting databases
- Creating and managing accounts
- Creating and managing privilege sets
- Viewing privilege sets
- Creating new privilege sets
- Editing existing privilege sets
- Duplicating and deleting privilege sets
- Editing record access privileges
- Editing layouts privileges
- Editing value list privileges
- Editing scripts privileges
- Editing extended privileges for a privilege set
- Editing other privileges
- Managing extended privileges
- Opening files protected with passwords
- Authorizing access to files
- Creating a database
- Sharing data
- Sharing databases on a network
- Saving, importing, and exporting data
- Saving and sending records in other formats
- Sending email messages based on record data
- Importing data into FileMaker Pro
- Methods of importing data into an existing file
- About creating a new table for imported data
- About validating data during import
- Importing data into an existing file
- Setting up recurring imports
- Importing a folder of files all at once
- Importing Bento data (OS X)
- Importing XML data
- Setting the import action and mapping fields during import
- Converting a data file to a new FileMaker Pro file
- Exporting data from FileMaker Pro
- Exporting repeating field data
- Supported import/export file formats
- Importing and exporting dates
- Working with Microsoft Excel
- Publishing databases on the web
- Using ODBC and JDBC with FileMaker Pro
- Accessing external data sources
- Using FileMaker Pro Advanced
- FileMaker Pro Advanced basics
- Customizing files with FileMaker Pro Advanced
- Using FileMaker Pro Advanced tools
- Debugging scripts (FileMaker Pro Advanced)
- Using the Data Viewer (FileMaker Pro Advanced)
- Encrypting database files (FileMaker Pro Advanced)
- Documenting database schemas (FileMaker Pro Advanced)
- Setting up files for developer solutions (FileMaker Pro Advanced)
- About creating runtime solutions (FileMaker Pro Advanced)
- Preparing files for a runtime solution (FileMaker Pro Advanced)
- Binding files into a runtime solution (FileMaker Pro Advanced)
- Naming runtime solutions (FileMaker Pro Advanced)
- Distributing runtime solutions (FileMaker Pro Advanced)
- Importing data into upgraded runtime solutions (FileMaker Pro Advanced)
- Starting runtime solutions (FileMaker Pro Advanced)
- Recovering runtime files (FileMaker Pro Advanced)
- Displaying databases in Kiosk mode (FileMaker Pro Advanced)
- Reference
- Setting preferences
- Keyboard shortcuts (Windows)
- Keyboard shortcuts (OS X)
- Functions reference
- Script steps reference
- Script triggers reference
- OnObjectEnter
- OnObjectKeystroke
- OnObjectModify
- OnObjectValidate
- OnObjectSave
- OnObjectExit
- OnPanelSwitch
- OnRecordLoad
- OnRecordCommit
- OnRecordRevert
- OnLayoutKeystroke
- OnLayoutEnter
- OnLayoutExit
- OnLayoutSizeChange
- OnModeEnter
- OnModeExit
- OnViewChange
- OnGestureTap
- OnFirstWindowOpen
- OnLastWindowClose
- OnWindowOpen
- OnWindowClose
- FileMaker Pro features by version
- Maintaining and recovering FileMaker Pro databases
- FileMaker Pro error codes
- Glossary
- Registration
- Customer Support and Knowledge Base
- Copyright information

Creating charts from data
F
ILEMAKER PRO HELP 405
You can also chart summary data by subcategory (for example, total sales by company within one
country). To do so, you could change the chart settings specified in this example as follows:
• sort records by the main category, then the subcategory (for example, sort by Country, then
by Company)
• set the x-axis or category labels to the subcategory (Company)
• place the chart in a subsummary layout part sorted by the main category (Country)
This chart compares total sales by company within one country.
Related topics
About chart types
Chart planning guidelines
About layout part types
Column, bar, line, and area charts
To get started creating a chart, see Creating quick charts or Creating and editing charts in Layout
mode.
1. Find the records you want to chart. See Making a find request.
If you are charting delimited data stored in a single record or data from related records, you
must specify data source settings. See
Specifying the data source for a chart.
2. In the Chart Setup dialog box, choose a chart type. See About chart types.
3. Enter the following settings:
For X-Axis
(Horizontal)
Do this
Title
Type a title or click , choose Specify Field Name or Specify Calculation,
complete the dialog box, and click OK.
100000
0
Japan
200000
0
USAUK
100000
200000
Total Sales by Country
0
ABC Company
50000
0
XYZ, Inc.DEF Ltd.
50000
Total Sales in the USA