
User manual
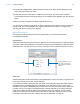
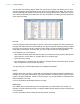


Table Of Contents
- Chapter 1 Introducing FileMaker Pro
- Chapter 2 Using databases
- About database fields and records
- Opening files
- Opening multiple windows per file
- Closing windows and files
- Saving files
- About modes
- Viewing records
- Adding and duplicating records
- Deleting records
- Entering data
- Working with data in Table View
- Finding records
- Performing quick finds in Browse mode
- Making find requests in Find mode
- Finding text and characters
- Finding numbers, dates, times, and timestamps
- Finding ranges of information
- Finding data in related fields
- Finding empty or non-empty fields
- Finding duplicate values
- Finding records that match multiple criteria
- Finding records except those matching criteria
- Viewing, repeating, or changing the last find
- Saving find requests
- Deleting and reverting requests
- Hiding records from a found set and viewing hidden records
- Finding and replacing data
- Sorting records
- Previewing and printing databases
- Automating tasks with scripts
- Backing up database files
- Setting preferences
- Chapter 3 Creating databases
- Planning a database
- Creating a FileMaker Pro file
- Creating and changing fields
- Setting options for fields
- Creating database tables
- Creating layouts and reports
- Working with layout themes
- Setting up a layout to print records in columns
- Working with objects on a layout
- Working with fields on a layout
- Working with parts on a layout
- Creating and editing charts
- Chapter 4 Working with related tables and files
- Chapter 5 Sharing and exchanging data
- Sharing databases on a network
- Importing and exporting data
- Saving and sending data in other formats
- Sending email messages based on record data
- Supported import/export file formats
- Setting up recurring imports
- ODBC and JDBC
- Methods of importing data into an existing file
- About adding records
- About updating existing records
- About updating matching records
- About the importing process
- Converting a data file to a new FileMaker Pro file
- About the exporting process
- Working with external data sources
- Publishing databases on the web
- Chapter 6 Protecting databases
- Protecting databases with accounts and privilege sets
- Creating accounts and privilege sets
- Viewing extended privileges
- Authorizing access to files
- Security measures
- Enhancing physical security
- Enhancing operating system security
- Establishing network security
- Backing up databases and other important files
- Installing, running, and upgrading antivirus software
- Chapter 7 Converting databases from FileMaker Pro 11 and earlier
- Index

Chapter 3 | Creating databases 74
You can also view summary data in Table View, which lets you group your data by one or more
columns (fields) and check subtotals for each group of grand totals for the table. The summary
results recalculate and update in real time when you change data values in Table View. You can
also create charts directly from Table View. For more information on creating dynamic reports and
quick charts, see Help.
List view
A List view layout contains the fields you select, in the order you specify from left to right across
the page, with field names as column headings. This layout is good for viewing or printing multiple
records in rows (a list of records). If there are many fields, columns will extend beyond the right
page margin of the layout. To prevent this, you can constrain columns to the page width.
In the assistant, you can choose to:
1 add header and footer parts with static text (like your company's name), dynamic text (like the
page number or current date), or a graphic (like your company logo)
1 group records by sorting
1 save information in a script to rerun the report (for example, switch to the report layout, sort the
data, and pause to let you preview the report)
You can modify any of these options after you complete the assistant.
Report
A Report layout lets you set up a report with grouped data and optional totals and subtotals. For
example, you can group sales data by region, then subtotal—or subsummarize—sales for each
region, and add a grand total. As with a List view layout, you can add header or footer parts and
save information in a script.
For more information about Report layouts, see Help.
Blank layout
Use a Blank layout as the starting point for a layout that you create entirely from scratch, for
example, a complex data entry screen. You add the fields and other objects you want on the layout
in Layout mode.
For more information about creating layouts and reports, see Help.