
Tutorial
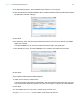
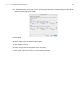
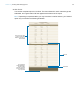
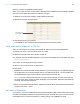

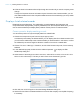
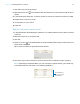
Table Of Contents
- Lesson 1 FileMaker Pro basics
- Lesson 2 Browsing information
- Lesson 3 Finding and sorting records
- Use quick find to search a database
- Find records based on criteria in a single field
- Find records based on criteria in specific separate fields
- Find records that match multiple criteria in the same field
- Find records that match a range of criteria in the same field
- Narrow your search
- Save a find request to use later
- Find records using a saved find
- Sort your found set
- Add a new record in List View
- For more information
- Lesson 4 Creating a database and entering records
- Lesson 5 Customizing what you see
- Lesson 6 Creating lists, mailing labels, and form letters
- Lesson 7 Simplifying data entry
- Lesson 8 Automating tasks with buttons and scripts
- Lesson 9 Creating and running reports
- Lesson 10 Charting data
- Lesson 11 Making databases relational
- Lesson 12 Sharing and exchanging data
- Lesson 13 Protecting data in FileMaker Pro
- Lesson 14 Backing up your databases

Lesson 10 | Charting data 66
6. In the Chart inspector, for Title, type Revenue by Company.
7. For Type, choose Pie.
The chart preview updates to display the new title and chart type.
8. For Options, select Show values on chart and Percentages.
9. Click Save As Layout, then OK.
The completed chart appears in Browse mode.
Notes
1 You can choose a layout containing a quick chart from the Layout pop-up menu to display it
later.
1 To modify a chart, switch to Layout mode and double-click the chart.
10. When you are finished with this lesson, close the file by choosing File menu > Close.
For more information
You have created a pie chart that displays summarized data from the current found set. For more
information about charting data, see chapter
3 of the FileMaker Pro User’s Guide and
FileMaker
Pro Help.