
Tutorial
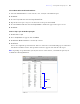
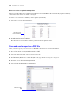

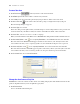
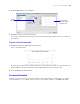

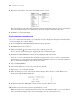
Table Of Contents
- Contents
- Lesson 1 FileMaker Pro basics
- Lesson 2 Browsing information
- Lesson 3 Finding and sorting records
- Use quick find to search a database
- Find records based on criteria in a single field
- Find records based on criteria in specific separate fields
- Find records that match multiple criteria in the same field
- Find records that match a range of criteria in the same field
- Narrow your search
- Save a find request to use later
- Find records using a Saved Find
- Sort your found set
- Add a new record in List View
- For more information
- Lesson 4 Creating a database and entering records
- Lesson 5 Customizing what you see
- Lesson 6 Creating lists, mailing labels, and form letters
- Lesson 7 Simplifying data entry
- Lesson 8 Automating tasks with buttons and scripts
- Lesson 9 Creating and running reports
- Lesson 10 Charting data
- Lesson 11 Making databases relational
- Lesson 12 Sharing and exchanging data
- Lesson 13 Protecting data in FileMaker Pro
- Lesson 14 Backing up your databases

76 FileMaker Pro Tutorial
Create a line chart
1. Click Form View in the layout bar to switch to Form View.
2. Click Edit Layout in the status toolbar to switch to Layout mode.
3. Select Body on the layout, then drag the body layout part down to make room for the chart.
4. Click the Chart tool in the status toolbar, then drag a large rectangle in the body layout part.
The Chart Setup dialog box appears.
5. For Chart Type, choose Line.
Notice the chart preview updates when you make changes to chart settings. However, the preview does
not show data from your database until you view the chart in Browse, Find, or Preview modes.
6. For Chart Title, enter Stock Value of ABC Company.
When you click outside the Chart Title text box, FileMaker Pro adds quotation marks around the title text.
7. For Horizontal (X) Axis, click , choose Specify Field Name, choose Month in the list, then click OK.
The data values in the Month field will appear as labels at the bottom of your chart (the X-axis data
series). This is the data you are comparing (in this case, the month that stock prices were reported).
8. For Vertical (Y) Axis, click , choose Specify Field Name, choose Price in the list, then click OK.
The data values in the Price field will appear as points connected by a line in your chart (the Y-axis data
series). This is the data you are measuring (in this case, the price that was reported each month).
9. For Use Data From, choose Current Found Set.
Change the chart format to Poly-line
FileMaker Pro offers two formats for line charts: curve fitting and poly-line. The distinction between data
points is emphasized when you use straight lines (poly-line).
1. Click Format Chart.
You see the Format Chart dialog box.