
Tutorial
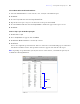

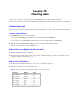
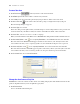
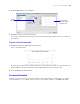

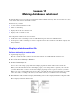
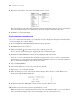
Table Of Contents
- Contents
- Lesson 1 FileMaker Pro basics
- Lesson 2 Browsing information
- Lesson 3 Finding and sorting records
- Use quick find to search a database
- Find records based on criteria in a single field
- Find records based on criteria in specific separate fields
- Find records that match multiple criteria in the same field
- Find records that match a range of criteria in the same field
- Narrow your search
- Save a find request to use later
- Find records using a Saved Find
- Sort your found set
- Add a new record in List View
- For more information
- Lesson 4 Creating a database and entering records
- Lesson 5 Customizing what you see
- Lesson 6 Creating lists, mailing labels, and form letters
- Lesson 7 Simplifying data entry
- Lesson 8 Automating tasks with buttons and scripts
- Lesson 9 Creating and running reports
- Lesson 10 Charting data
- Lesson 11 Making databases relational
- Lesson 12 Sharing and exchanging data
- Lesson 13 Protecting data in FileMaker Pro
- Lesson 14 Backing up your databases

Lesson 10
Charting data
You can create bar, line, area, and pie charts in FileMaker Pro to compare and contrast data.
In this lesson you will create a line chart showing a trend in the stock value of ABC Company over six months.
Create a line chart
Line charts are good for showing data that changes continuously over time, such as historical financial data.
Create a simple database
1. In FileMaker Pro, do one of the following:
1 If you see the FileMaker Quick Start Screen, click Create a New Database.
1 If you don’t see the FileMaker Quick Start Screen, choose File menu > New Database.
2. For File name, type Monthly Stock Results, and save the file in the Tutorial folder.
The file opens in Browse mode in Table View.
Add text fields to the Monthly Stock Results table
1. Click Create Field and type Company.
2. To add two more fields on this layout, click + in the column heading, type Month, then click + in the
column heading again and type Price.
Add records to the database
1. Click below the Company heading to create a new record in the database.
2. Enter the following six records in Table View.
Tip Press Tab to move between fields. Click + to begin a new row.
Company Month Price
ABC Company January 13.00
ABC Company February 6.00
ABC Company March 10.00
ABC Company April 4.00
ABC Company May 15.00
ABC Company June 21.00