
Installation guide


20 Implementing Windows Terminal Server and Citrix MetaFrame on IBM ^ xSeries Servers
3.2.2 Interpreting your memory and CPU pilot results
From your pilot’s Performance Counter Logs, you can determine the final number of users
that you can expect to support on your terminal server hardware. Use Excel to graph the
Counter Log CSV files. Start by plotting the CPU utilization and the number of Active
Sessions on the same graph. This allows you to determine the CPU utilization for various
user loads.
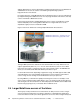
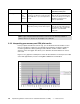
Figure 3-1 is a graph from a Citrix pilot. It shows the CPU utilization on a dual processor x335
server with approximately 15 users running Office 2000 and Lotus Notes® 5.
Figure 3-1 Processor utilization and active sessions during the MetaFrame pilot
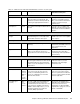
Working Set RDP or
ICA
session
number. *
The approximate amount of bytes used by
each user. Use Excel to convert each value
into a MB value so you can interpret more
easily.
The more programs a user runs, the
larger the per session Working Set
is. You can use this per user value to
determine your typical users’
memory requirements.
Physical Disk
% Disk Time _Total The average time the disk subsystem has
been busy serving a read or write request.
Low values. If this counter is more
than 70%, the disk subsystem may
be a bottleneck. This should not be a
problem on a fast SCSI disk
subsystem.
*: Each time a user logs on to WTS, they are allocated a new session number.
Object and counter Instance Description What to see for acceptable user
performance in the pilot...
Note: Logical and physical disk performance counters are automatically enabled on
demand. There is no need to run the diskperf -Y command.