
Troubleshooting guide


1-48
Cisco Wide Area Application Services Configuration Guide
OL-26579-01
Chapter 1 Monitoring and Troubleshooting Your WAAS Network
Configuring Flow Monitoring
Any reports scheduled by an external user are deleted if the maximum limit of days without a login
passes and the user is deleted. For more information, see the cdm.remoteuser.deletionDaysLimit system
configuration property in Table 1-4 on page 1-18.
Configuring Flow Monitoring
Flow monitoring applications collect traffic data that is used for application trend studies, network
planning, and vendor-deployment impact studies. This section describes how to configure the flow
monitoring feature on the WAE and includes the following topics:
• Alarms for Flow Monitoring, page 1-49
• Example Using NetQoS for Flow Monitoring, page 1-50
The NetQoS monitoring application can interoperate with the WAAS software to provide flow
monitoring. To integrate this application with the WAAS software, you configure the NetQoS FlowAgent
module on the WAE devices. The NetQoS FlowAgent module on the WAE collects important metrics of
packet flows, which are then sent across the network to the NetQoS SuperAgent. This monitoring agent
analyzes the data and generates reports. For this feature to work, additional configuration is required on
the NetQoS FlowAgent. (See the “Example Using NetQoS for Flow Monitoring” section on page 1-50.)
The monitoring agent is composed of two modules: the console (or host) and the collector. The WAE
initiates two types of connections to these two monitoring agent modules: a temporary connection to the
console and a persistent connection to the collector. You configure the console IP address on the WAE
by entering the flow monitor tcpstat-v1 host configuration mode command in either the WAE CLI or
through the Central Manager GUI. This temporary connection is referred to as the control connection.
The control connection uses TCP port 7878. Its purpose is to obtain the IP address and port number of
the collector to which the WAE is assigned. The WAE also pulls the configuration information regarding
which servers are to be monitored over the control connection. Once the WAE obtains the IP address and
port number of the collector, the WAE opens a persistent connection to the collector. Collected summary
data for the servers that are being monitored is sent over this persistent connection.
You may place the console (or host) module and the collector module on a single device or on separate
devices. These connections are independent of one another. A failure of one connection does not cause
the failure of the other connection and vice versa.
The state of these connections and various operation statistics display when you use the show statistics
flow monitor tcpstat-v1 EXEC mode command. Connection errors and data transfer errors trigger
alarms on the WAE and in the Central Manager GUI. (See the “Alarms for Flow Monitoring” section on
page 1-49.) To display debug information, use the debug flow monitor tcpstat-v1 EXEC mode
command.
To configure flow monitoring on your WAEs using the Central Manager GUI, follow these steps:
Step 1 Create a new device group for configuring flow monitoring on multiple devices. Choose Device
Groups > device-group-name > Create New Device Group to create a device group.
a. When you create the device group, check the Automatically assign all newly activated devices to
this group check box to enable this option.
b. Add your existing WAE devices to this new device group.
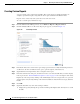
Step 2 From the Device Group listing window, click the Edit icon next to the name of the flow monitoring
configuration device group that you want to configure.
Step 3 Choose Configure > Monitoring > Flow Monitor. The Flow Monitor Settings for Device Group
window appears.