
Troubleshooting guide


1-41
Cisco Wide Area Application Services Configuration Guide
OL-26579-01
Chapter 1 Monitoring and Troubleshooting Your WAAS Network
Using Predefined Reports to Monitor WAAS
• Applied Policy/Bypass Reason—Displays icons representing the applied optimization policies,
including TFO, DRE, LZ, and an application accelerator, respectively (hover your mouse over the
icon to see its meaning). If the connection was not optimized, the bypass reason is shown.
• Connection Start Time—Date and time when the connection was started.
• Open Duration—Number of hours, minutes, and seconds that the connection has been open.
• Total number of original bytes.
• Total number of optimized bytes.
• Percentage of compression.
• Classifier name—If no classifier exists for the connection, this column contains a Create New
button. Click the button to display a Classifier Settings form below the table where you can create
a classifier that matches the source and destination IP addresses and ports of the connection. Enter
a name in the Classifier Name field, check the Match All check box to match all traffic, or make
selections from the Source IP, Source Port, Destination IP, and Destination Port drop-down lists.
Then, click the Create Classifier button to create the classifier.
Note If the WAE is inheriting policies from a device group, the Create New button is not shown, to prevent a
user from unknowingly overriding device group policies. To create a classifier, you must first override
the device group policy page and then return to the Connection Statistics report.
The data in the Connections Summary Table is retrieved from the device one time when you view the
window for the first time.
Click the Refresh button at the bottom of the window to refresh the data in the Connections Summary
Table.
From the Connections Summary Table for Device window, you may perform the following tasks:
• Apply filter settings to display particular connections based on criteria that you choose.
• View connection details.
• Click the Reset Filter button to reset the filter options and refresh the table.
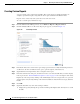
Click the Details icon next to the connection entry in the summary table to view connection details. The
Connection Details window appears. This window contains connection addresses, port information,
policy information, and traffic statistics. The Connection Details window also displays graphs that plot
real-time traffic statistics and are refreshed every two seconds.
Note If the value for Percentage Compression is negative, the Percentage Compression and Effective
Capacity values do not appear.
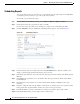
CIFS Acceleration Report
The CIFS Acceleration report displays the CIFS acceleration statistics for a WAAS device. The
following charts are included on two tabs:
• CIFS: Connection Statistics—Displays the number of CIFS accelerated sessions.
• CIFS: File Optimization—Displays the number of open CIFS files.
• CIFS: Request Optimization—Displays the percentage of requests that are served locally from the
CIFS cache.