
Troubleshooting guide


1-40
Cisco Wide Area Application Services Configuration Guide
OL-26579-01
Chapter 1 Monitoring and Troubleshooting Your WAAS Network
Using Predefined Reports to Monitor WAAS
The Summary Report can be customized to display the charts that you require. Use the Customize
taskbar icon to select the charts that you want to be displayed on this report. Only 12 charts can be
displayed in the report.
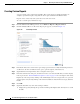
Topology Report
The Topology report at the system level displays a topology map that shows a graphical representation
of all the connections between the WAAS devices.
The topology map uses blue squares to show connections between devices. Use the legend to the right
of the grid to associate the device name with the number that appears at the top of the grid. Use the
drop-down lists at the top of the window to perform the following tasks:
• Display connections between your various locations instead of between devices.
• Sort the grid by the number of connections instead of by device name.
Click the View icon next to the WAE to view a list of peer devices for a specific WAE. The Peer List
window appears, which is the same as the device level Topology report.
At the device level, the Topology report lists all the peer devices connected to a specific WAE so that
you can see the relationship between devices in your WAAS network. The Peer List window displays
information about each peer device involved in optimized connections with this WAE. To go to the
system level Topology report, click the Topology icon in the taskbar.
If a peer device is not registered with the WAAS Central Manager, the message “Unknown, this peer is
not being managed by CM” is shown for the name and “Unknown” is displayed for the IP address.
Note The WAAS Central Manager device does not have any peers because it does not participate with any
WAEs to optimize traffic. For this reason, the topology feature is not available on the WAAS Central
Manager device.
Connection Trend Report
The Connection Trend Report displays the connection trends of applications on a device. The following
charts are included:
• Optimized Connections Over Time, page 1-26
• Optimized vs Pass-Through Connections, page 1-26
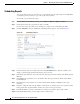
Connections Statistics Report
The Connections Statistics report displays a Connections Summary table for the device. The table
displays all the TCP connections handled by the device and corresponds to the show statistics
connection EXEC mode command in WAE and the show waas connection brief command in WAAS
Express.
The report displays the following information about each connection:
• Source IP address and port.
• Destination IP address and port.
• Peer ID—Hostname of the peer device.