
Troubleshooting guide


1-39
Cisco Wide Area Application Services Configuration Guide
OL-26579-01
Chapter 1 Monitoring and Troubleshooting Your WAAS Network
Using Predefined Reports to Monitor WAAS
• SMB: Effective WAN Capacity, page 1-23
• SMB: Connection Details, page 1-23
• SMB: Request Optimization, page 1-24
• SMB: Response Time Savings, page 1-24
• SMB: Client Average Throughput, page 1-23
• SMB: Versions Detected, page 1-24
• SMB Acceleration Statistics Table, page 1-33
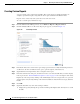
ICA Acceleration Report
The ICA Acceleration report displays the ICA acceleration statistics. The following charts and tables are
included:
• ICA: Effective WAN Capacity, page 1-24
• ICA: Connection Details, page 1-24
• ICA: Client Versions, page 1-24
• ICA: Unaccelerated Reasons, page 1-25
• ICA Acceleration Statistics Table, page 1-31
Note The ICA charts in WAAS version 5.0 and later are different from those used in version 4.5. If you are
viewing the data from a version 4.5 WAAS device, the charts appear empty due to the different data that
the device is collecting. The ICA data for version 4.5 WAAS devices is available in the system level TCP
Summary Report.
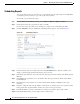
Summary Report
The Summary Report is a predefined report that can be used to monitor the system operation. It is
available at the system level. This report displays the following charts and tables by default:
• Traffic Summary, page 1-16
• Effective WAN Capacity, page 1-15
• Traffic Summary Over Time, page 1-16
• Traffic Volume and Reduction, page 1-16
• Compression Summary, page 1-15
• Compression Summary Over Time, page 1-15
• HTTP: Estimated Time Savings, page 1-17
• HTTP: Effective WAN Capacity, page 1-17
• MAPI: Effective WAN Capacity, page 1-21
• SSL: Effective WAN Capacity, page 1-20
• MAPI: Average Response Time Saved, page 1-21
• Network Application Traffic Details Table, page 1-30