
Troubleshooting guide

1-36
Cisco Wide Area Application Services Configuration Guide
OL-26579-01
Chapter 1 Monitoring and Troubleshooting Your WAAS Network
Using Predefined Reports to Monitor WAAS
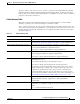
The following predefined reports are available only at the device level:
• Optimization
–
Connections Statistics Report, page 1-40
• Acceleration
–
CIFS Acceleration Report, page 1-41 (not available for a WAAS Express device)
–
CIFS Acceleration Report for WAAS Express, page 1-42 (available only for a WAAS Express
device)
• Platform (not available at the WAAS Express device level)
–
Resource Utilization Report, page 1-42
–
Disks Report, page 1-42
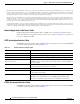
The following predefined reports are available only at the AppNav Cluster level and at the device level
for AppNav Controller devices:
• AppNav > AppNav Report, page 1-43
Note In a WAAS network where there are 1000 or more WAEs, there may be a delay of up to 90 seconds to
redisplay the table when you click a table column to resort any system level report table. You may
experience a similar delay when you click the Print icon in the taskbar, before you see the report.
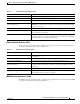
Location Level Reports
Location level reports aggregate data from all the WAEs present in a particular location. For more
information about locations, see the “Working with Device Locations” section on page 1-9.
To view a location level report, follow these steps:
Step 1 From the WAAS Central Manager menu, choose Locations > location-name.
Step 2 Choose Monitor and choose the report from the Optimization or Acceleration categories.
When scheduling any report, you can also select one or more locations and the report will include data
from all devices within the selected locations. For more information, see the “Scheduling Reports”
section on page 1-46.
The maximum number of devices supported in a location level report is 25 by default. This number is
configurable up to 250 by the System.monitoring.maxDevicePerLocation system property. For more
information, see the “Modifying the Default System Configuration Properties” section on page 1-17.
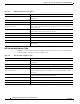
TCP Summary Report
The TCP Summary report displays a summary of all traffic. The following charts and tables are included:
• Traffic Summary, page 1-16
• Effective WAN Capacity, page 1-15
• Traffic Volume and Reduction, page 1-16