
Troubleshooting guide

1-35
Cisco Wide Area Application Services Configuration Guide
OL-26579-01
Chapter 1 Monitoring and Troubleshooting Your WAAS Network
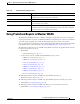
Using Predefined Reports to Monitor WAAS
Using Predefined Reports to Monitor WAAS
The WAAS Central Manager includes a number of predefined reports that you can use to monitor the
system operation. These reports are available in the Monitor menu. The reports consist of a combination
of specific charts and graphs and a statistical table displayed in the lower part of the window.
You can customize these predefined reports by editing them with the Manage Report function available
in the Monitor menu, as described in the “Viewing and Editing Reports” section on page 1-45.
The following predefined reports are available at the WAAS system level, the AppNav Cluster level, the
location level, and the device level:
• Optimization
–
TCP Summary Report, page 1-36
• Acceleration (not all are available at the WAAS Express device level)
–
HTTP Acceleration Report, page 1-37
–
HTTPS Acceleration Report, page 1-37
–
Video Acceleration Report, page 1-37
–
SSL Acceleration Report, page 1-38
–
MAPI Acceleration Report, page 1-38
–
NFS Acceleration Report, page 1-38
–
SMB Acceleration Report, page 1-38
–
ICA Acceleration Report, page 1-39
The following predefined report is available only at the WAAS System level:
• Network > Summary Report, page 1-39
The following predefined report is available only at the WAAS System level and the device level:
• Network/Peers > Topology Report, page 1-40
The following predefined report is available only at the device level and the location level:
• Optimization > Connection Trend Report, page 1-40
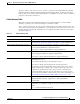
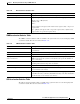
Bypassed Connections Reports the number of connections initially received by the CIFS accelerator
and then pushed down to the generic accelerator.
Total Time Saved Reports the amount of time saved due to CIFS optimization.
Total Round-Trip Time Reports the total round-trip time for all connections plus the time for remotely
served metadata cache misses.
% Time Saved Reports the percentage of connection time saved for all aggregated samples.
Total Time Saved by cache hits / (Total Time Saved by cache hits + Total time
for all remotely served metadata cache misses)
Table 1-14 CIFS Acceleration Statistics Table
Table Column Description and Formulas Used to Calculate Value