
Troubleshooting guide

1-33
Cisco Wide Area Application Services Configuration Guide
OL-26579-01
Chapter 1 Monitoring and Troubleshooting Your WAAS Network
Chart and Table Descriptions
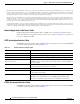
SMB Acceleration Statistics Table
The SMB Acceleration Statistics table is available at the system and device levels and displays SMB
acceleration details. The data is described in Table 1-11.
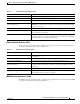
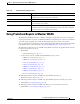
SSL Acceleration Statistics Table
The SSL Acceleration Statistics table is available at the system and device levels and displays SSL
acceleration details. The data is described in Table 1-12.
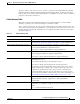
Avg. Remote Response Time Reports the average time used for remote responses, in milliseconds.
% Time Saved Reports the percentage of connection time saved for all aggregated samples.
(Down – Up) * 100 / (Down)
If(Down != 0)
where:
Down = (New local request count + New remote request count) * Avg. local
response time
Up = ((New local request count * Avg. local response time) + (New remote
request count * Avg. remote response time))
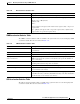
Table 1-10 NFS Acceleration Statistics Table
Table Column Description and Formulas Used to Calculate Value
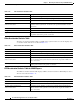
Table 1-11 SMB Acceleration Statistics Table
Table Column Description and Formulas Used to Calculate Value
Device The device name. (Appears only at the system level. WAAS Express devices are
not included.)
Start Time and End Time Start and end times for the time period. (Appears only at the device level.)
New Connections Handled Reports the number of SMB connections handled for the time period.
Average Active Connections/
Active Connections
Reports the average number of connections currently being handled by the
SMB accelerator at the system level. At other levels, reports the number of
active connections.
Bypassed Connections Reports the number of connections initially received by the SMB accelerator
and then pushed down to the generic accelerator.
Total Time Saved Reports the amount of time saved due to SMB optimization.
Total Round-Trip Time Reports the total round-trip time for all connections plus the time for remotely
served metadata cache misses.
% Time Saved Reports the percentage of connection time saved for all aggregated samples.
Total Time Saved by cache hits / (Total Time Saved by cache hits + Total Time
for all remotely served metadata cache misses)