
Troubleshooting guide

1-30
Cisco Wide Area Application Services Configuration Guide
OL-26579-01
Chapter 1 Monitoring and Troubleshooting Your WAAS Network
Chart and Table Descriptions
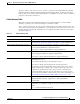
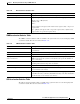
Network Application Traffic Details Table
The Network Application Traffic Details table is available at the system level and displays the total
traffic information for each application. The data is the same as described in Table 1-5 (except there is
no Device column in this table).
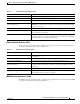
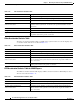
HTTP Acceleration Statistics Table
The HTTP Acceleration Statistics table is available at the system and device levels and displays HTTP
acceleration details. The data is described in Table 1-6.
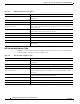
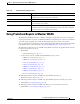
HTTPS Acceleration Statistics Table
The HTTPS Acceleration Statistics table is available at the system and device levels and displays HTTPS
acceleration details. The data is described in Table 1-7.
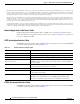
1. The number in the Pass-Through Traffic column represents the amount of traffic that is passed through that particular WAE (or for a location report, all
the devices in the location). If the device is part of a serial inline cluster (that is, configured as a non-optimizing peer with another device), the traffic that
is shown as pass-through on one device may have been optimized by another device in the serial cluster. It is useful to know the amount of traffic that is
not optimized by either of the devices in the cluster (in other words, passed through the entire cluster).
When the device closer to the LAN is not overloaded, the pass through numbers on that device accurately represent the overall pass-through traffic. But,
if that device goes into overload, the second device in the cluster starts optimizing traffic that was passed through by the first one, which needs to be
accounted for. In this case, the overall pass-through numbers for the cluster can be obtained as follows. Note that this calculation has to be done even if
the first device went into overload in the past and came out of it.
Consider that W1 and W2 are part of a serial cluster and W1 is toward the LAN (closer to the client if the cluster is in the branch, or closer to the server
if the cluster is in the data center) and W2 is toward the WAN. The amount of traffic that is passed through the cluster without optimization by either W1
or W2 can be obtained by the following formula: (W1 pass-through traffic) – (W2 original traffic)
Table 1-6 HTTP Acceleration Statistics Table
Table Column Description and Formulas Used to Calculate Value
Device The device name. (Appears only at the system level.)
Start Time and End Time Start and end times for the time period. (Appears only at the device level.)
New Connections Handled Reports the number of HTTP connections handled for the time period.
Average Active Connections/
Active Connections
Reports the average active number of connections currently being handled by
the HTTP accelerator at the system level. At other levels, reports the number of
active connections.
New Bypassed Connections Reports the number of connections initially received by the HTTP accelerator
and then pushed down to the generic accelerator.
Total Time Saved Reports the amount of time saved due to HTTP optimization.
Total Round-Trip Time Reports the total round-trip time for all connections plus the time for remotely
served metadata cache misses.
% Time Saved Reports the percentage of connection time saved for all aggregated samples.
Total Time Saved / (Total Time Saved + Total Round Trip Time For All
Connections + Total time for all remotely served metadata cache misses)