
Troubleshooting guide

1-29
Cisco Wide Area Application Services Configuration Guide
OL-26579-01
Chapter 1 Monitoring and Troubleshooting Your WAAS Network
Chart and Table Descriptions
To get the statistics at the system, location, and device group levels, the Original Inbound, Original
Outbound, Optimized Inbound, Optimized Outbound, Pass-through Client, and Pass-through Server
bytes of all devices are added together. The Reduction % and Effective Capacity values are calculated
using these added values of all devices.
Traffic Summary Table
This table is called the Network Traffic Summary, Device Traffic Summary, or Location Traffic
Summary, depending on the context and it displays a summary of traffic.
At the system and location levels, each row in the table displays the total traffic information for each
device that is registered to this Central Manager or is in this location. At the device level, each row in
the table displays the total traffic information for each application defined on the device. The data is
described in Table 1-5.
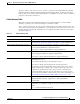
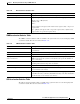
Ta b l e 1- 5 Tr a f f i c S u m m a r y Ta b l e
Table Column Description and Formulas Used to Calculate Value
Device The device name. (Appears only at the system and location levels.)
Application The application name. (Appears only at the device level. At the system level,
use the Network Application Traffic Details Table to get this information.)
Original Traffic (Excludes Pass-Through) Reports the amount of original traffic, excluding pass-through traffic.
System: (Original Outbound + Original Inbound)/2
Device/Device Group: Original Inbound + Original Outbound
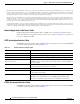
Optimized Traffic (Excludes Pass-Through) Reports the amount of optimized traffic, excluding pass-through traffic.
System: (Optimized Inbound + Optimized Outbound)/2
Device/Device Group: Optimized Outbound + Optimized Inbound
Pass-Through Traffic Reports the amount of pass-through traffic. This value is not applicable for
WAAS Express devices.
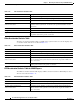
System: (Pass-through Client + Pass-through Server)/2
Device/Device Group: Pass-through Client + Pass-through Server
An asterisk (*) in the column heading indicates that a device whose data is
included in this table is configured as a serial peer with another device and
optimization is disabled between those two peer devices. The amount of
pass-through traffic shown may be more than what is expected because the
device passes through traffic coming from its peer (for more information, see
the “Information About Clustering Inline WAEs” section on page 1-53).
1
Reduction (%) Reports the percentage of bytes saved, considering only optimized traffic.
(Original Excl Pass-through – (Optimized)) * 100 / (Original Excl
Pass-through)
Effective Capacity Reports the effective bandwidth capacity of the WAN link as a result of
optimization, as a multiplier of its base capacity, considering only optimized
traffic.
1/(1 – % Reduction Excl Pass-through)