
Troubleshooting guide


1-26
Cisco Wide Area Application Services Configuration Guide
OL-26579-01
Chapter 1 Monitoring and Troubleshooting Your WAAS Network
Chart and Table Descriptions
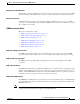
Optimized Connections Over Time
The Optimized Connections Over Time chart displays the number of optimized connections over the
selected time period. You can show the number of MAPI reserved connections by checking the MAPI
Reserved Connections check box. You can customize the chart by choosing specific applications to
include; the default is all traffic.
This chart is available only when a specific WAAS device is selected and can be added only to the
Connection Trend report.
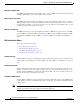
Optimized vs Pass-Through Connections
The Optimized vs Pass-Through Connections chart displays the total number of optimized and
pass-through connections on a device or on all devices in a location. You can show the device connection
limit, which is the maximum number of connections a device can support, by checking the Device
Connection Limit check box. This option is available only at the device level.
This chart is available only when a specific WAAS device or location is selected and can be added only
to the Connection Trend report.
Formula:
Pass-Through Connections for a Device = Total Pass-Through Connections for all applications
Optimized Connections for a Device = Total Optimized Connections for all applications
AppNav Charts
This section describes these charts:
• Total AppNav Traffic, page 1-26
• AppNav Policies, page 1-26
• Top 10 AppNav Policies, page 1-27
• Top 10 WAAS Node Group Distribution, page 1-27
• WAAS Node Group Distribution, page 1-27
• Pass-Through Reasons, page 1-27
• Top 10 Pass-Through Reasons, page 1-27
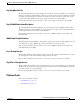
Total AppNav Traffic
The Total AppNav Traffic chart displays the total amount of distributed and pass-through traffic
processed by the AppNav Cluster or ANC device. The units at the left side depend upon the range.
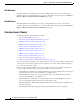
AppNav Policies
The AppNav Policies chart displays a graph of the amount of intercepted, distributed, or pass-through
traffic processed by the AppNav Cluster or ANC device for each policy rule, depending on which tab
you select. The units at the left side depend upon the range.
From the Show Details For drop-down list, you can select a policy rule for which to show details.