
Troubleshooting guide


1-18
Cisco Wide Area Application Services Configuration Guide
OL-26579-01
Chapter 1 Monitoring and Troubleshooting Your WAAS Network
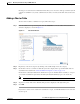
Chart and Table Descriptions
HTTP: Optimization Count
The HTTP Optimization Count chart displays a graph of the number of different kinds of optimizations
performed by the HTTP accelerator, which are displayed in different colors. The optimizations included
in this chart are fast connection reuse and metadata caching.
HTTP: Optimization Techniques
The HTTP Optimization Techniques pie chart displays the different kinds of optimizations performed
by the HTTP accelerator. The optimizations included in this chart are fast connection reuse, metadata
caching, suppressed server compression, and DRE hinting.
HTTP: Response Time Savings
The HTTP Response Time Savings chart displays a graph of the round-trip response time saved by the
HTTP accelerator due to metadata caching and fast connection reuse optimizations, which are displayed
in different colors. The time units (milliseconds, seconds, or minutes) at the left side depend on the
range.
HTTPS Acceleration Charts
This section describes the following charts:
• HTTPS: Connection Details, page 1-18
• HTTPS: Effective WAN Capacity, page 1-18
• HTTPS: Estimated Time Savings, page 1-18
• HTTPS: Optimization Count, page 1-19
• HTTPS: Optimization Techniques, page 1-19
• HTTPS: Response Time Savings, page 1-19
HTTPS: Connection Details
The HTTPS Connection Details chart displays the HTTPS session connection statistics, showing the
average number of active HTTPS connections per device (at the device level for the last hour it shows
the exact number). Click the Details tab to display the newly handled HTTPS connections and optimized
connections.
HTTPS: Effective WAN Capacity
The HTTPS Effective WAN Capacity chart displays the effective bandwidth capacity of the WAN link
as a result of HTTP acceleration, as a multiplier of its base capacity. The capacity data for all traffic and
SSL traffic (which includes HTTPS traffic) is shown.
Note If the chart has no data, monitoring may be disabled for the application definition that includes this type
of traffic. Make sure that monitoring is enabled for the SSL application.
HTTPS: Estimated Time Savings
The HTTPS Estimated Time Savings chart displays the estimated percentage of response time saved by
using metadata caching for HTTPS connections.