
Troubleshooting guide


1-16
Cisco Wide Area Application Services Configuration Guide
OL-26579-01
Chapter 1 Monitoring and Troubleshooting Your WAAS Network
Chart and Table Descriptions
Throughput Summary
The Throughput Summary chart displays the amount of average and peak throughput for the
LAN-to-WAN (outbound) or WAN-to-LAN (inbound) directions depending on the selected tab. The
throughput units (kbps, mbps, or gbps) at the left side vary depending on the range. The Peak Throughput
series is not applicable for Last Hour graphs. This chart is available only at the device and location levels.
Formula:
% Reduction Excluding Pass-Through = (Original Excluding Pass-Through – Optimized) / (Original
Excluding Pass-Through)
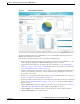
Traffic Summary
The Traffic Summary chart displays the top nine applications that have the highest percentage of traffic
as seen by WAAS. Each section in the pie chart represents an application as a percentage of the total
traffic on your network or device. Unclassified, unmonitored, and applications with less than 2 percent
of the total traffic are grouped together into a tenth category named Other Traffic (shown only if it totals
at least 0.1 percent of all traffic). You can choose to display Original traffic or Optimized traffic by
clicking the tab, and you can include pass-through traffic by checking the Include Pass-Through check
box.
Formula:
(App Traffic/ Total Traffic) * 100
App Traffic is the Original traffic (Original Excluding Pass-Through) or Optimized traffic (Optimized
Excluding Pass-Through) flowing for an application.
Traffic Summary Over Time
The Traffic Summary Over Time chart displays a graph of the amount of original or optimized traffic,
depending on the selected tab, and you can include pass-through traffic by checking the Pass-Through
check box. You can customize the chart by choosing specific applications to include; the default is all
traffic.
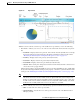
Traffic Volume and Reduction
The Traffic Volume and Reduction chart compares the amount of original and optimized traffic in a bar
chart and displays the percentage of traffic reduction as a line. Pass-through traffic is excluded. The
traffic units (bytes, KB, MB, or GB) at the right side depend upon the range. The percentage of traffic
reduction is shown at the left side of the chart. You can customize the chart by choosing specific
applications to include; the default is all traffic.
Formula:
% Reduction Excluding Pass-Through = (Original Excluding Pass-Through – Optimized) / (Original
Excluding Pass-Through)
Acceleration Charts
This section describes these charts: