
Troubleshooting guide


1-14
Cisco Wide Area Application Services Configuration Guide
OL-26579-01
Chapter 1 Monitoring and Troubleshooting Your WAAS Network
Chart and Table Descriptions
Configuring Chart Settings
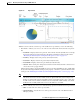
To configure the data presented in a chart, follow these steps:
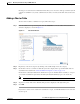
Step 1 Click the Edit icon in the upper right corner of a chart. The Settings window is displayed.
Note Not all settings are available for all chart types.
Step 2 (Optional) From the Traffic Direction drop-down list, choose one of the following options:
• Bidirectional—Includes LAN to WAN traffic as well as WAN to LAN traffic traveling through this
WAAS device.
• Inbound—Includes traffic from the WAN to the client through this WAAS device
• Outbound—Includes traffic traveling from a client to the WAN through this WAAS device.
Step 3 (Optional) In the Select Series For drop-down list, choose one of the following:
• Application—The chart data is based on application statistics.
• Classifier—The chart data is based on classifier (class map) statistics.
Step 4 (Optional) In the Application or Classifier list, check the box next to the applications or classifiers whose
statistics you want to include in the chart data. To include all applications, check All Traffic. You can
filter the list items by using the Quick Filter above the list. This list is available only for some chart types.
Step 5 (Optional) Some charts have other types of data series from which to choose. Check the box next to each
data series that you want to include in the chart data.
Step 6 Click OK.
Note Data collection for applications and classifiers happens at slightly different times in the Central
Manager, so the statistics can be different when viewing the same time period for an application and a
classifier that report similar data.
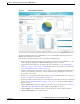
Chart and Table Descriptions
This section describes the charts and tables that you can choose to include in a dashboard or report. The
following categories are available:
• TCP Optimization Charts, page 1-15
• Acceleration Charts, page 1-16
• Connection Trend Charts, page 1-25
• AppNav Charts, page 1-26
• Platform Charts, page 1-27
• Statistics Details (Tables), page 1-28
All charts are plotted using the Central Manager local time zone, unless the chart settings were
customized to use a different time zone.