
Troubleshooting guide


1-13
Cisco Wide Area Application Services Configuration Guide
OL-26579-01
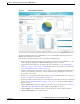
Chapter 1 Monitoring and Troubleshooting Your WAAS Network
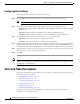
Customizing a Dashboard or Report
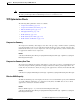
Chart-type icons at the bottom of individual charts allow you to choose the chart type as follows (not all
controls are available in every chart): column chart, line chart, area chart, stacked line chart, stacked area
chart.
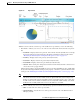
Adding a Chart or Table
To add a chart or table to a dashboard or report, follow these steps:
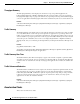
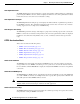
Step 1 From the dashboard or report chart panel, click the Customize icon in the taskbar. The Customize
window is displayed, as shown in Figure 1-7.
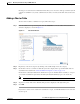
Figure 1-7 Customize Window
Step 2
Expand any of the chart categories by clicking on the small triangle next to the category.
Step 3 Check the box next to each chart or table that you want to display in the report. Individual charts are
described in more detail in the “Chart and Table Descriptions” section on page 1-14.
Charts that are currently included in the dashboard or report are marked with an asterisk (*). A report
can contain a maximum of eight charts and tables (the Network Summary report can contain 12).
Note At the WAAS Express device level, only charts for supported accelerators are available.
Step 4 To preview a chart, click on the chart title. The preview is displayed on the right of the pane.
Step 5 Click OK.
If you want to delete a chart or table from a dashboard or report, click the Close button on the chart and
save the report.