
Troubleshooting guide


1-12
Cisco Wide Area Application Services Configuration Guide
OL-26579-01
Chapter 1 Monitoring and Troubleshooting Your WAAS Network
Customizing a Dashboard or Report
When you change the time zone, the change applies globally to all reports. The time zone setting is
stored individually for each Central Manager user.
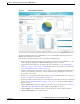
• Save—Saves the dashboard or report with its current settings. The next time you view it, it is
displayed with these settings.
• Save As—Saves the report with its current settings under a new name. A popup window allows you
to enter a report name and an optional description. You can enter only the following characters:
numbers, letters, spaces, periods, hyphens, and underscores. The report will be available in the
Monitor > Reports > Reports Central window.
• Customize—Allows you to add a chart or table to a dashboard or report. For information on adding
a chart or table, see the “Adding a Chart or Table” section on page 1-13.
• Schedule—Allows you to schedule reports to be generated once or periodically such as hourly, daily,
weekly, or monthly. When a scheduled report is generated, you can have a PDF copy of the report
e-mailed to you automatically.
–
In the Date field, enter the schedule date in the format DD/MM/YYYY or click the calendar
icon to display a calendar popup window from which to choose the date.
–
In the Hours drop-down list, choose the hours. The time represents the local time at the WAAS
Central Manager.
–
In the Minutes drop-down list, choose the minutes. The time represents the local time at the
WAAS Central Manager.
–
In the Frequency drop-down list, choose Once, Hourly, Daily, Weekly, or Monthly for the
report frequency.
–
In the No. of Reports field, enter the number of times that a reoccurring report is to be generated.
After a report is generated a specified number of times, the report is no longer generated.
–
In the Email Id(s) field, enter the e-mail addresses of the report recipients, separated by
commas.
–
In the Email Subject field, enter the subject of the e-mail message.
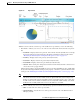
• Reports—Allows you to view the scheduled reports. For instructions to view scheduled reports, see
the “Managing Scheduled Reports” section on page 1-47.
• PDF—Generates a PDF format of the report, including the charts and table data.
• Export—Exports the chart statistical data to a CSV file. The statistical data shown in charts is
rounded to whole units (KB, MB, or GB), while the exported data contains exact byte values.
Controls at the top of individual charts allow you to customize the chart as follows (not all controls are
available in every chart):
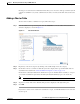
• Chart title—Allows you to click and drag to move the chart to a different location in the report pane.
• Edit icon—Allows you to edit the chart settings as described in the “Configuring Chart Settings”
section on page 1-14.
• Collapse/Expand icon—Allows you to collapse or expand the chart. When a chart is collapsed, this
icon changes to Expand, which restores the chart to its normal size.
• Close icon—Closes the chart.
• Tabs—Allows you to have a choice of multiple tab views that you can access by clicking on the
desired tab name (not all charts have this feature).
• Check box to show additional data—Allows you to check the box labeled with an optional data
statistic to include the data in the chart (not all charts have this feature).