
Troubleshooting guide


1-11
Cisco Wide Area Application Services Configuration Guide
OL-26579-01
Chapter 1 Monitoring and Troubleshooting Your WAAS Network
Customizing a Dashboard or Report
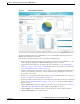
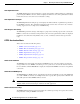
Figure 1-6 Report Pane
Taskbar icons and controls across the top of the dashboard or report allow you to do the following:
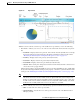
• Time Frame—Allows you to choose one of the several common time frames from the drop-down
list:
–
Last Hour—Displays data for the past hour, in five-minute intervals (default). You can change
the interval using the System.monitoring.collectRate configuration setting described in the
“Modifying the Default System Configuration Properties” section on page 1-17.
–
Last Day—Displays data for the past day (in hourly intervals).
–
Last Week—Displays data for the past week (in daily intervals).
–
Last Month—Displays data for the past month (in daily intervals).
–
Custom—Enter starting and ending dates in the From and To fields. Click the calendar icon to
choose dates from a popup calendar.
The time frame setting is stored individually for each report and Central Manager user. Additionally,
the System.monitoring.timeFrameSettings system property controls the system default time frame
setting (see the “Modifying the Default System Configuration Properties” section on page 1-17).
Note If you create a chart with a custom date setting that spans more than two months back from the
current date, the most recent two months of data are plotted with daily data and all previous
months are plotted with aggregated monthly data. The chart might appear to have a large drop
in traffic for the most recent two months because the daily traffic totals are likely to be much
smaller than the monthly traffic totals; however, this difference is normal.
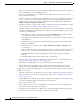
• Time Zone—Allows you to choose one of the following options from the Time Zone drop-down list:
–
UTC—Sets the time zone of the report to UTC.
–
CM Local Time—Sets the time zone of the report to the time zone of the WAAS Central
Manager (default).