
Troubleshooting guide


1-3
Cisco Wide Area Application Services Configuration Guide
OL-26579-01
Chapter 1 Monitoring and Troubleshooting Your WAAS Network
Viewing System Information from the System Dashboard Window
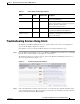
• Compression Summary chart—Displays the ten applications with the highest percentage of traffic
reduction for the WAAS network for the last hour. The percent calculation excludes pass-through
traffic.
Numbers shown in charts and graphs are rounded to whole units (KB, MB, or GB), while those displayed
in tables are rounded to three decimal places. Data values exported to CSV files are in bytes, so are not
rounded.
You can customize the graphical displays and tables that are displayed on the system dashboard. For
more information, see the “Customizing a Dashboard or Report” section on page 1-10. Individual charts
are described in more detail in the “Chart and Table Descriptions” section on page 1-14.
Much of the device, statistical, and alarm information that is presented in the system dashboard and
associated graphs and charts is also available programmatically through the monitoring API. For more
information, see the Cisco Wide Area Application Services API Reference.
Note You must synchronize the clock on each WAE device within 5 minutes of the primary and secondary
WAAS Central Managers for statistics to be consistent and reliable. For information on using an NTP
server to keep all your WAAS devices synchronized, see the “Configuring NTP Settings” section on
page 1-5. Additionally, if the network delay for the Central Manager to receive statistical updates from
the WAEs is greater than 5 minutes, statistics aggregation may not operate as expected.
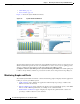
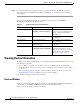
Alarm Panel
The alarm panel provides a near real-time view of incoming alarms and refreshes every two minutes to
reflect updates to the system alarm database.
To view the alarms panel, click Alarms at the bottom right side of the Central Manager window.
Only Active alarms can be acknowledged in the alarm panel. Pending, Offline, and Inactive alarms
cannot be acknowledged in the alarm panel.
The alarm panel also allows you to filter your view of the alarms in the list. Filtering allows you to find
alarms in the list that match the criteria that you set.
Figure 1-2 shows the alarm panel.
Figure 1-2 Alarm Panel