
Troubleshooting guide


1-2
Cisco Wide Area Application Services Configuration Guide
OL-26579-01
Chapter 1 Monitoring and Troubleshooting Your WAAS Network
Viewing System Information from the System Dashboard Window
• Alarm Panel, page 1-3
• Device Alarms, page 1-4
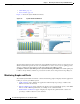
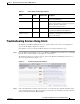
Figure 1-1 shows the System Dashboard window.
Figure 1-1 System Dashboard Window
The information displayed in the charts in the System Dashboard window is based on a snapshot of your
WAAS network that represents the state of your WAE devices at the end of every two polling periods.
You may configure the interval between polls in the WAAS Central Manager GUI
(Configure > Global > System Properties > System.monitoring.collectRate). The default polling rate
is 300 seconds (5 minutes). Alarms are presented in real time and are independent of the polling rate.
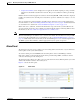
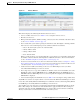
Monitoring Graphs and Charts
The default System Dashboard window contains the following graphical displays about the application
traffic processed by your WAAS system:
• Traffic Summary chart—Displays the applications with the highest percentage of traffic in the
WAAS network for the last hour.
• Effective WAN Capacity graph—Displays the effective increased bandwidth capacity of the WAN
link as a result of WAAS optimization, as a multiple of the actual bandwidth.
• Traffic Volume and Reduction graph—Displays the original and optimized traffic volume and
percentage of traffic reduction over the last hour.