
Troubleshooting guide


1-26
Cisco Wide Area Application Services Configuration Guide
OL-26579-01
Chapter 1 Using the WAE Device Manager GUI
Monitoring the WAE
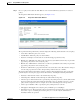
• Remote requests count—Total number of client CIFS requests that were forwarded remotely over
the WAN. The name of this statistic is a link that you can use to display its historical graphs (without
first going to the Graphs tab). Local requests are also shown on these graphs.
• Local requests count—Total number of client CIFS requests handled locally by this device. The
name of this statistic is a link that you can use to display its historical graphs (without first going to
the Graphs tab). Remote requests are also shown on these graphs.
• Total remote time—Total amount of time, in milliseconds, spent by this device to process all client
CIFS requests that were sent remotely over the WAN.
• Total local time—Total amount of time, in milliseconds, spent by this device to process all client
CIFS requests that were handled locally.
• Connected sessions count—Total number of CIFS sessions connected on this device. The name of
this statistic is a link that you can use to display its daily, weekly, monthly, and yearly graphs
(without first going to the Graphs tab).
• Open files count—Total number of open CIFS files on this device. The name of this statistic is a link
that you can use to display its daily, weekly, monthly, and yearly graphs (without first going to the
Graphs tab).
• CIFS Command Statistics—Table of statistics on CIFS commands. For each command type, the
table lists the total number of requests, the number of remote requests, the number of asynchronous
requests, the average time in milliseconds spent by this device to process each request that was
handled locally, and the average time in milliseconds spent by this device to process each request
that was sent remotely over the WAN.
To reset the CIFS statistics, click the Reset CIFS Statistics button below the table.
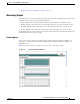
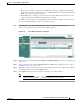
Step 2 Click the Cache tab.
The Cache tab displays the following information:
• Maximum cache disk size—Maximum amount of disk space (in gigabytes) allocated to the CIFS
device cache.
• Current cache disk usage—Current amount of disk space (in kilobytes) used by the CIFS device
cache. The name of this statistic is a link that you can use to display its historical graphs (without
first going to the Graphs tab).
• Maximum cache resources—Maximum number of resources (files and directories) allowed in the
CIFS device cache.
• Current cache resources—Current number of resources contained in the CIFS device cache. The
name of this statistic is a link that you can use to display its historical graphs (without first going to
the Graphs tab).
• Evicted resources count—Number of resources that have been evicted from the cache since the
device was started.
• Last eviction time—Time when a cache eviction last occurred.
• Cache size high watermark—Percentage of disk usage that causes the CIFS device to begin evicting
resources.
• Cache size low watermark—Percentage of disk usage that causes the CIFS device to stop evicting
resources.
• Cache resources high watermark—Percentage of total cache resources that causes the CIFS device
to begin evicting resources.
• Cache resources low watermark—Percentage of total cache resources that causes the CIFS device
to stop evicting resources.