
Troubleshooting guide


1-24
Cisco Wide Area Application Services Configuration Guide
OL-26579-01
Chapter 1 Using the WAE Device Manager GUI
Monitoring the WAE
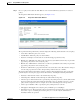
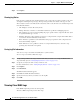
Tip Each graph in an index window acts as a link. Clicking on the graph displays all four historical graphs
for the selected statistic. For example, clicking the Request Optimization graph in the index graphs
window displays the daily, weekly, monthly and yearly Request Optimization historical graphs. Clicking
the Back button in the browser returns you to the index graphs.
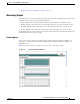
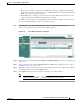
Figure 1-16 shows a sample screen when a user chooses to view the historical graphs for a particular
statistic.
Figure 1-16 Sample Historical Graph Window
Note Graphs can be printed using the Print command in your browser.
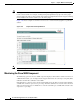
Monitoring the Cisco WAE Component
The Monitoring option for the Cisco WAE component displays a table with the statistics monitored on
a WAE. From this table, you can display historical graphs that indicate the central processing unit (CPU)
utilization and disk drive utilization on the WAE.
CPU utilization is a measure of the amount of bandwidth used by the CPU versus the total bandwidth
available. The amount is expressed as a percentage. Disk drive utilization is a measure of the amount of
disk space that is being used on all disk drives versus the total disk space available. This amount is also
expressed as a percentage.