
Troubleshooting guide


1-23
Cisco Wide Area Application Services Configuration Guide
OL-26579-01
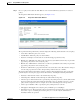
Chapter 1 Using the WAE Device Manager GUI
Monitoring the WAE
• Monitoring a Transparent CIFS Accelerator, page 1-25
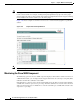
Monitoring Graphs
The WAAS software generates four historical graphs for each monitored statistic. Each graph presents
a different range of time for the selected data as follows:
• Daily—Displays data for the past 24 hours. Each data point represents a 5-minute average.
• Weekly—Displays data for the past seven days. Each data point represents a 30-minute average.
• Monthly—Displays data for the past five weeks. Each data point represents a 2-hour average.
• Yearly—Displays data for the past 12 months. Each data point represents a one-day average.
The maximum value over the given time period and the current value for the statistic being monitored is
also displayed below each of these graphs.
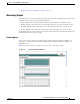
Viewing Options
You can view an index window of the daily graphs for all the monitored statistics available for a
component, or you can view the four historical graphs for a particular statistic (for example, cache
utilization) at once.
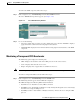
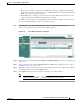
Figure 1-15 shows a sample screen when a user chooses to view the index graphs.
Figure 1-15 Sample Index Graph Window