
Troubleshooting guide


1-37
Cisco Wide Area Application Services Configuration Guide
OL-26579-01
Chapter 1 Configuring AppNav
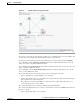
Monitoring an AppNav Cluster
• (WN only) Optimization tab that lists the application accelerators and their status
• Alarms tab that lists pending alarms on the device
• Interfaces tab that lists the device interfaces and status. You can filter the list by choosing a filter
type from the drop-down list above the interface list, entering filter criteria, and clicking the filter
icon.
You can pin the status popup window so it stays open by clicking the pin icon in the upper right corner.
You can also drag the popup to any location within your browser window.
For additional cluster status, you can view the Monitor > AppNav > AppNav Report as described in the
“AppNav Report” section on page 1-43.
If you have multiple AppNav Clusters, you can see brief status for all at once by choosing AppNav
Clusters > All AppNav Clusters from the menu.
To trace connections, see the “AppNav Connection Tracing” section on page 1-37.
Note You may see a taskbar icon named Force Settings on all Devices in a Group if the configuration across
all ANCs in the cluster becomes unsynchronized. If you see the icon, the cluster settings, ANC
configuration, WN configuration, and WNG configuration do not match on all ANCs in the cluster. This
problem can occur if you configure a device outside the Central Manager by using the CLI. Click this
taskbar icon to update all devices with the configuration that is currently shown in the Central Manager
for the cluster.
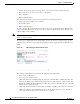
AppNav Connection Tracing
To assist in troubleshooting AppNav flows, you can use the Connection Trace tool in the Central
Manager. This tool shows the following information for a particular connection:
• If the connection was passed through or distributed to a WNG
• Pass-through reason, if applicable
• The WNG and WN to which the connection was distributed
• Accelerator monitored for the connection
• Class-map applied
To use the Connection Trace tool, follow these steps:
Step 1 From the WAAS Central Manager menu, choose AppNav Clusters > cluster-name.
Step 2 Choose Monitor > Tools > Connection Trace.
Step 3 In the AppNav Controller drop-down list, choose the ANC that has the connection you want to trace.
Step 4 From the Site (Remote Device) drop-down list, choose the peer WAAS device at the remote site.
Step 5 In one or more of the Source IP, Source Port, Destination IP, and Destination Port fields, enter matching
criteria for one or more connections.
Step 6 Click Trace to display the connections that match the IP address and port criteria.
Connections are displayed in the Connection Tracing Results table below the fields. Use the filter
settings in the Show drop-down list to filter the connections as needed. You can use a quick filter to filter
on any value or show all connections.