
Specifications


A Principled Technologies test report 3
Cisco UCS B200 M3 Blade Server:
Uncompromised virtual desktop performance
0
1,000
2,000
3,000
4,000
5,000
6,000
5 29 54 75 96 120 141 163 183
Miiliseconds
Number of users
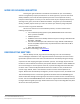
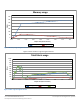
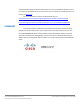
Response times for virtual desktops on a single Cisco UCS B200 M3
Blade Server
Average Response VSI Index Average
Figure 1: Average virtual desktop response times at various numbers of virtual desktops on the Cisco UCS B200 M3
Blade Server.
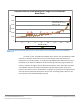
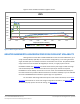
To initiate our test, we enabled our VMware View 5 pool to start up all Windows 7 VMs
and reach an idle state. We monitored our test bed during the startup and perceived no
bottlenecks in server CPU, network, or storage I/O at the VMware View default startup rate of
five VMs at a time. When the VMs were idle, we started Login VSI testing. Figure 2 shows the
processor utilization throughout the test. With 193 simultaneous users, 186 of which achieved
an acceptable response time as determined by the Login VSI 3.0 benchmark, nearly all 16
processor cores were at close to full utilization. The graph line represents the average utilization
across all 16 cores (32 threads) thought out the boot, idle, and testing phases. When the test
was complete, all virtual desktops began to log off.
Login VSImax = 186
Dynamic VSImax = 4,223
Baseline = 978