
User guide


D-56
Cisco Media Gateway Manager 5.0 User Guide
OL-5461-02
Appendix D Statistics Summary
Physical Line Statistics
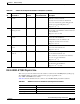
18 PLCP bip 8-errors No Ingress–1 Provides a count of the PLCP BIP-8 errors on
the T3 line.
Range: 0 to (2
40
–1) cells
19 PLCP far end blocked
errors
No Ingress–1 Provides a count of the far end block errors that
are encountered by the PLCP interface on the T3
line.
Range: 0 to (2
40
–1) cells
20 Seconds with at least one
PLCP bip-8 error
No Ingress–1 Provides a count of the seconds with at least one
PLCP BIP-8 error detected on the T3 line.
Range: 0 to (2
40
–1) cells
21 Seconds with 5 PLCP
bip-8 errors n
No Ingress–1 Provides a count of the seconds with at least five
PLCP BIP-8 errors that are detected on the T3
line.
Range: 0 to (2
40
–1) cells
22 Seconds with T3 PLCP far
end blocked errors
No Ingress–1 Provides a count of the seconds with PLCP far
end block errors that are detected on the T3 line.
Range: 0 to (2
40
–1) cells
23 Seconds with 5 PLCP
FEBE errors + PLCP YEL
No Ingress–1 Provides a count of the seconds with at least five
PLCP far end block errors (FEBE) and yellow
defects detected on the T3 line.
Range: 0 to (2
40
–1) cells
24 Seconds with T3 severely
errored framing
No Ingress–1 Provides a count of the severely errored framing
seconds that occur within the collection interval
on the T3 line.
Range: 0 to (2
40
–1) cells
25 T3 PLCP unavailable
seconds
No Ingress–1 Provides a count of the unavailable seconds on
the T3 line.
Unavailable seconds are defined as 10
contiguous severely errored seconds.
Range: 0 to (2
40
–1) cells
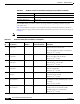
26 PLCP Framing Errors No Ingress–1 Provides a count of the framing errors that are
detected by the PLCP interface on the T3 line.
Range: 0 to (2
40
–1) cells
27 PLCP Framing Error
Seconds
No Ingress–1 Provides a count of seconds that framing errors
are detected by PLCP interface on the T3 line.
Range: 0 to (2
40
–1) cells
28 PLCP Severely Errored
Framing Seconds
No Ingress–1 Provides a count of the severely errored seconds
based on PLCP framing errors detected on the
T3 line.
Range: 0 to (2
40
–1) cells
Table D-46 AXSM-E T3/E3 Physical Line Statistics—Descriptions (continued)
Stat
ID
AXSM-E T3/E3 Physical
Line Statistics
Subset of Other
Statistics
Ingress/Egress
Measurement Point Description