
User guide


10-20
Cisco Media Gateway Manager 5.0 User Guide
OL-5461-02
Chapter10 Managing Performance
What Types of Data Reports Are Available?
Step 3 Drag the node to the right hand pane to display the Connection Browser window.
Step 4 Click the Connection List tab.
Step 5 Enter the number of connections you want to retrieve in the Connection Count to be retrieved field.
To retrieve all the connections, enter *.
Step 6 Click Get to retrieve the connections. For example, you can retrieve connections for both local and
remote endpoints for the node.
The Connection Browser window appears with the number of connections matching the filtering criteria.
A list of connections that have either local or remote endpoints are displayed in the connection list.
Step 7 Right-click the connection type from the list of connections and choose Statistics Report. The Statistics
Report opens.
Step 8 Choose Performance Data Report from the drop-down arrow.
Step 9 Choose Performance Data Report for Conn from the drop-down arrow.
Step 10 From the Time Period Parameters area:
a. Choose one of the following time period schedules:
–
TOD (Time of Day) This value is specified by the user.
–
Prev Hour
–
Prev Day
–
Prev Week
b. Enter the start date in dd/mm/yyyy in the Start Date field.
c. Enter the start time in h:mm in the Start Time field.
d. Enter the end date in dd/mm/yyyy in the End Date field.
e. Enter the start time in h:mm in the End Time field.
Step 11 Click Select Connection(s) to view the available connections.
Step 12 Select the connection.
Step 13 Click Next.
Step 14 Click Generate Report to generate the report for connection endpoints.
Note If you want to stop generating the Performance Data Report, click Stop Report Generation.
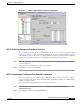
10.5.3.5 Displaying Performance Data Report for Connections
After you finished generating the Performance Data Report, you must ensure that the report displays one
chart for the connection local endpoint performance data and the other chart for the connection remote
endpoint performance data.
To display the graphical representation of the Performance Data Report for connection endpoints:
Step 1 Verify the performance data information by using the formulas. For information about the formulas for
a port, see Table 10-8.
The performance data information for connection endpoints is displayed.