
User guide


9-10
Cisco Media Gateway Manager 5.0 User Guide
OL-5461-02
Chapter 9 Managing Faults
Where Can I Get Information on Affected Services and Customers?
9.2.6 Diagnostic Center
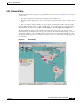
The Diagnostic Center provides a hierarchical representation of network elements, which include
networks, nodes, cards, lines and ports displayed in tree format in the Hierarchy pane of the Diagnostic
Center’s main window. Associated information about a selected network element is displayed in table
format in the right panel of the Diagnostic Center window (See Figure 9-5).
Each network element managed by Cisco MGM has its own attributes and fits into the network’s
physical or logical hierarchy. The Diagnostic Center presents the network elements that are discovered,
managed, and controlled in a hierarchical view for all networks populated in the tables by Cisco MGM
processes.
The Diagnostic Center displays the network elements in a hierarchical format based on either a physical
or logical relationship among the various network elements. Networks are displayed at the root level of
the component tree; nodes are displayed beneath the networks in a parent/child relationship.
The Diagnostic Center also displays informational messages in a multiline text display; other types of
messages can be displayed in response to user actions.
The Diagnostic Center can be opened for an NE, group, or the domain. Select a node in the Domain
Explorer Hierarchy pane and choose Fault > MGX8880/8850 MG > Diagnostic Center.
The Diagnostic Center has two access tabs:
• Diagnostic—Displays the diagnostic status and test results for the network elements.
• Manageability—Monitors the statistics events for network manageability
The Diagnostic Center allows users to:
• Diagnose network elements, for example, networks, nodes, cards, lines, ports, or paths. By
diagnosing network elements, you can:
–
Monitor real-time counters.
–
Extend support for the Node Resync process to allow for two different levels.
–
Configure bit error rate test (BERT) to verify the integrity of a network element by measuring
error statistics.
• Monitor statistic events for network manageability to collect element management health-related
statistics. In addition, you can:
–
Verify that all the nodes in the network are managed correctly by Cisco MGM.
–
Identify general network problems.
–
Provide success rates, failure rates, and throughput of Cisco MGM to protocols such as FTP,
and SNMP.
–
Create a trouble ticket that extracts all the information from the History Panel.
• Diagnose connections to:
–
Access fault management capabilities in the form of diagnostic tests for connections, which
include continuity (integrity) facility for PNNI soft permanent virtual connection (SPVC).
–
Perform general test operations such as up and down connections, and connection loopback.