
User guide


9-7
Cisco Media Gateway Manager 5.0 User Guide
OL-5461-02
Chapter 9 Managing Faults
Where Can I Get Information on Affected Services and Customers?
Note Clicking Refresh Data in the Domain Explorer window refreshes all data for the entire client and closes
all open windows (except the Domain Explorer window). Depending on the number of NEs in the
network, there might be some delay while the data refreshes. The status bar shows the status after the
Domain Explorer refreshes. It will show “Refresh Data Complete.”
The Fault menu and associated toolbar tools are listed next to their corresponding menu options in
A.3.3 Fault Menu.
9.2.4 Alarm Browser
The Alarm Browser displays standing alarms and conditions in the managed domain that are assigned a
severity level of critical, major, minor, or warning. It also shows cleared alarms that are not
acknowledged. See Figure 9-3. The Alarm Browser and Alarm Log views provide a robust listing of all
current and historical alarms and events. See the “9.9.1 Archiving Alarm Log” section on page 9-50 for
more information about the Alarm Log.
To display the Alarm Browser, select an NE, group, or domain node from the Domain Explorer, or
Network Map; then, choose Fault > Alarm Browser (or click the Open Alarm Browser tool from the
Dashboard). Use the toolbar buttons to manage the alarm display. These buttons are described in
“A.3.1 File Menu” section on page A-7.
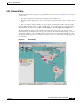
Figure 9-3 Alarm Browser
Table 9-1 provides descriptions of the fields in the Alarm Browser.