
Specifications


© 2006 Cisco Systems, Inc.
All rights reserved.
Product Features 2-40
NAM / Traffic Analyzer v3.5 Tutorial
© 2006 Cisco Systems, Inc. All rights reserved.
Product Features 2-40
NAM / Traffic Analyzer v3.5 Tutorial
Getting Started
Navigation Menu
Getting Started
Navigation Menu
Alarms:
Configure alarm
parameters
Data Source:
Configure SPAN and
NetFlow sources
Switch/Router
Parameters: Setup
NAM communication
with host device
Monitoring:
configure data
collection
Configure All
Monitoring Options
View All Data
Collection Reports
View Host Statistics
View Application
Statistics
View Overview of
several statistics
View Application
Response Time
Statistics
View Conversation
Statistics
View DiffServ
Statistics
View Voice Statistics
View Device Based
Statistics
Configure custom
filter options
Decode:
View captured
packets in decoded
format
Buffers:
Set up and manage
capture buffers
(including capture
filters). Start and
stop capture. View
and decode
captured packets.
Files:
Save packets in
capture buffers to
files. Decode and
download files.
Set and Run Packet
Capture Options
View All Alarm
Reports
NAM:
View alarms
generated by
NAM
(applications,
conversations,
hosts, voice,
ART, DiffServ
Switch:
View Port Level
Alarms (6k-NAM
only)
System:
View system
resources, and
configure NAM
parameters
User:
Configure Web
users and
TACACS+
Diagnostics
Configure
NAM Options
Setup Monitor Capture Alarms Admin
Preferences:
Configure interface
preferences
View VLAN
Statistics (6K-NAM
only)
Configure and
View Historical
Reports
Basic:
Reports for
application, host,
conversation,
voice, DiffServ,
and ART
Custom:
Combine multiple
basic reports into
single custom
report
Reports
Protocol Directory:
Setup application
protocols
View MPLS Stats
(6K NAM only)
Scheduled Export
via Email or FTP
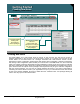
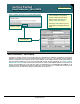
Navigation Menu
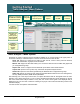
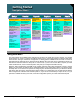
The user interface for the NAM Traffic Analyzer has six tabs in the upper third of every window. You will find
all the options you need to configure the NAM monitoring and to view reports based on collected data under
these six tabs. The figure outlines the configuration or viewing options available under each tab. It is useful to
remember that the data that can be viewed under the Monitor tab is the result of the configuration options you
selected and executed under the Setup tab. In other words, if you do not see the data or reports you want
under the Monitor tab, return to the Setup tab to verify that you configured the NAM correctly.
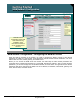
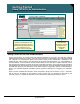
Similarly, alarms generated by the NAM can be viewed under the Alarms tab. Remember, however, that the
alarms you view under the Alarms tab are generated based on the configuration options you selected under
the Setup tab. You do have a few options for configuring how the data is presented to you within the Monitor
and Alarms tabs, but keep in mind that these options enable you to manipulate only the data that has already
been configured for collection under the Setup tab. So, if you do not see the data you expect to see, or if you
just want to validate the data you do see, review the configuration options you made under the Setup tab.