
Specifications


© 2006 Cisco Systems, Inc.
All rights reserved.
Product Features 2-39
NAM / Traffic Analyzer v3.5 Tutorial
© 2006 Cisco Systems, Inc. All rights reserved.
Product Features 2-39
NAM / Traffic Analyzer v3.5 Tutorial
Getting Started
Traffic Analyzer - Menu Options
Getting Started
Traffic Analyzer - Menu Options
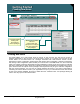
Navigation bar
shows you
where you are
within the NAM
menu options.
Navigation bar
shows you
where you are
within the NAM
menu options.
Available
Submenus for
Selected
Function
Option
Available
Submenus for
Selected
Function
Option
Options for configuring
the NAM data collection
and report functions.
Options for configuring
the NAM data collection
and report functions.
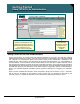
Available
Options for the
Selected Tab
Available
Options for the
Selected Tab
Viewing Alarms
Generated by
the NAM
Viewing Alarms
Generated by
the NAM
Packet Capture
and Decode
Options
Packet Capture
and Decode
Options
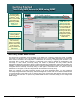
Options for
configuring & viewing
historical reports
Options for
configuring & viewing
historical reports
Options for
viewing data.
Options for
viewing data.
NAM
Administrative
Functions
NAM
Administrative
Functions
Content
window
Content
window
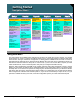
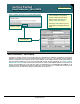
Traffic Analyzer – Menu Options
Everything you need to configure and use the NAM is available to you via the six tabs in the upper portion of
the screen. Following is a brief description of each of the functions found under the tabs.
Setup Tab: Options for configuring the NAM for data sources, monitor views, protocols collected,
alarms, and customization of graphs, charts and tables
Monitor Tab: Support for tasks that enable you to monitor the NAM such as the tables and graphs that
you configured during setup
Reports Tab: Tools to configure and view historical reports about various traffic statistics
Capture Tab: Options to set up, start, stop, and decode the packet analysis functions
Alarms Tab: Options to view alarms generated by the NAM that were configured during setup
Admin Tab: Options for setting up and configuring the administrative tasks such as user management,
security, SNMP parameters, NAM network parameters
After selecting one of the major function tabs, the options associated with the tab appear below the tabs.
Selecting one of these options may or may not have associated sub-tasks and will be displayed on the left
side of the NAM Traffic Analyzer window. At any time, the current context (path to the displayed task) is
displayed on the “You Are Here” context line. Clicking on any layer of the context line will take you back to the
associated display.
Let’s look at each of the options under these tabs.