
Specifications


© 2006 Cisco Systems, Inc.
All rights reserved.
Product Features 2-28
NAM / Traffic Analyzer v3.5 Tutorial
© 2006 Cisco Systems, Inc. All rights reserved.
Product Features 2-28
NAM / Traffic Analyzer v3.5 Tutorial
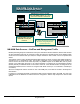
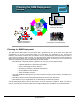
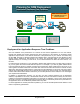
Planning for NAM Deployment
Application Response-Time Problems
Planning for NAM Deployment
Application Response-Time Problems
Server Farm
Client PC
Server Response Time
Server and Network Response Time
Deploy NAMs
closest to the
application servers
and clients.
Deploy NAMs
closest to the
application servers
and clients.
NAM NAM
NAMs could be either NAM-
1/2 or NM-NAM depending on
network equipment
NAMs could be either NAM-
1/2 or NM-NAM depending on
network equipment
Deployment for Application Response Time Problems
One true validation of the performance of a network is how well the applications run over the network,
because this variable most closely represents the user’s experience of the network. So, measuring critical
application response times is one effective barometer of the performance of your network. The NAM, using
the ART MIB, does this by capturing packets, time stamping them, and measuring the time between a client
request and the fulfillment of that request by the server. This information helps you identify where the
application delays are occurring—at the server, on the network between the client and server switch, or at
the client.
For response-time monitoring, it is very important to identify what response times you really want to measure
so you can gather the most accurate data and reports. For example, if you want to gather statistics about
how long it takes the server to complete a request (server think time), place a NAM close to the server. If you
want to gather information about both server think time and the time it takes the network to transmit the data
(flight time), then place the NAM closest to a client that uses the application on the server. We cannot stress
enough how critical NAM placement is for response-time reporting: the more accurate your understanding of
how the NAM collects these statistics and hence your accurate placement of the NAM, the more meaningful
your response-time data will be.
In addition to response-time reporting, you can also use other reporting features such as application
statistics, TopN talkers to the server, conversations between the server and clients to identify who the server
is talking to and what its bandwidth consumption is for each pair, or utilization or errors on the switch port that
the server connects to. All these perspectives and options help you both identify trends in the performance of
the application server and troubleshoot problems when they arise.
For acute application or network performance problems, you can use the NAM packet decode feature to view
traffic on a packet-by-packet basis.