
Specifications


© 2006 Cisco Systems, Inc.
All rights reserved.
Scenarios 3-62
NAM / Traffic Analyzer v3.5 Tutorial
© 2006 Cisco Systems, Inc. All rights reserved.
Scenarios 3-62
NAM / Traffic Analyzer v3.5 Tutorial
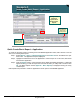
Scenario 5
View Top N Reports
Scenario 5
View Top N Reports
Narrow the types of
reports displayed
Narrow the types of
reports displayed
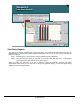
Top 10 applications
for each hour for
one day
Top 10 applications
for each hour for
one day
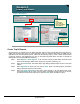
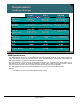
View Top N Reports
The data for the report are being logged every 15 minutes. Some time later Dean uses the following steps to
view the top applications on the WAN link:
Step 1. Select Reports > Basic Reports. The list of Basic Reports is displayed.
Step 2. Click the Top N report created, and click View. A new window opens showing the data
collected.
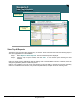
Dean can quickly see the applications that are utilizing most of the bandwidth over time. If desired, Dean can
change the granularity and the overall time period.
Dean is now confident in the use of his new network tool and its ability to provide him with the necessary
metrics to troubleshoot the network, verify network implementation, and plan for future network growth.