
Specifications


© 2006 Cisco Systems, Inc.
All rights reserved.
Scenarios 3-60
NAM / Traffic Analyzer v3.5 Tutorial
© 2006 Cisco Systems, Inc. All rights reserved.
Scenarios 3-60
NAM / Traffic Analyzer v3.5 Tutorial
Scenario 5
View Basic Reports
Scenario 5
View Basic Reports
View Basic Reports
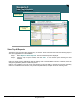
The data for the reports generated are being logged every 15 minutes. Some time later Dean uses the
following steps to view the three values together to determine how much of the link is being consumed by
these two protocols:
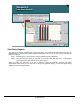
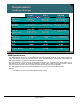
Step 1. Select Reports > Basic Reports. The list of Basic Reports is displayed.
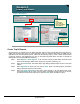
Step 2. Click all three basic reports to view them on the same graph, and click View. A new window
opens showing the data collected for the three reports.
Dean can quickly see that most of the link is utilized by these two protocols, especially the Q-Bits
development effort. Dean can use this GUI to change the graphical display, or even the reports being
displayed (if others were generated).