
Specifications


© 2006 Cisco Systems, Inc.
All rights reserved.
Scenarios 3-43
NAM / Traffic Analyzer v3.5 Tutorial
© 2006 Cisco Systems, Inc. All rights reserved.
Scenarios 3-43
NAM / Traffic Analyzer v3.5 Tutorial
Scenario 3
ART Client Server Data (VLAN 100)
Scenario 3
ART Client Server Data (VLAN 100)
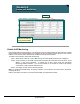
You can view response time by client server pairs to see if any
QoS or other modifications need to be made.
You can view response time by client server pairs to see if any
QoS or other modifications need to be made.
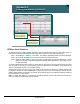
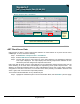
Monitor > Response Time > Client/Server
Response
times are
consistent
for all
clients
Response
times are
consistent
for all
clients
Zoom In for
More Details
Zoom In for
More Details
ART Client Server Data
Dean decides he wants to review response-time statistics for traffic between an IP phone and the Cisco
CallManager. To do so, he does the following:
Step 1. Select Monitor > Response Time > Client/Server.
Step 2. Select VLAN 100 from the Data Source pull-down list.
Step 3. Use the Filter option to select clients of server embu-callmgr2. The Client/Server Response
Time report is displayed. This report displays the summary response-time statistics for each
client/server pair seen during the last response-time interval.
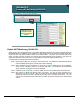
Dean notes that all clients using the embu-callmgr2 host are experiencing similar response times, but the
clients attaching to the other Cisco Call Manager are experiencing much quicker response times. The
difference in performance between these two Cisco Call Managers may be due to many things, including
configuration or the load on the server, but it can also be due to the proximity of the NAM to the server and
clients. Again, Dean now has facts to help isolate problems.
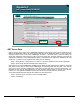
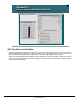
To see the time bucket breakdown for any client/server pair:
Step 4. Highlight the client/server pair to see more information about, and click Details. (see next page)